
Key Takeaways:
- By 2024, renters were more mobile than homeowners in all 100 of the largest U.S. cities — underscoring a gap that widened significantly since 2019.
- In 41 of the 100 largest cities, owner mobility fell while renter mobility rose to become the dominant pattern shaping today’s housing market.
- Port St. Lucie, Fla., recorded the sharpest divergence: Renter mobility surged 8.61 percentage points (pp) while owner mobility dropped, flipping a market where owners were more mobile than renters prior to the pandemic.
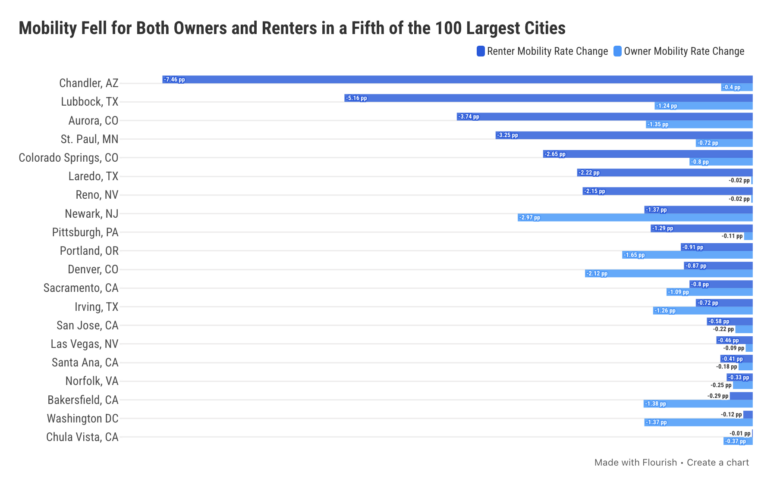
- Newark, N.J. saw the steepest owner mobility decrease in the study— down 2.97 pp — while Chandler, Ariz., recorded the sharpest renter mobility drop at 7.46 pp.
- A smaller group of 16 cities bucked the trend entirely with owner mobility rising as renter movement declined, led by North Las Vegas, Nev.
Long-Distance Owner & Renter Mobility Between 2019-2024
To understand how residential in-migration has evolved across the U.S. in recent years, we analyzed long-distance homeowner and renter mobility rates in the 100 largest cities between 2019 and 2024 — a period shaped by the pandemic, remote work, significant changes in mortgage rates and shifting housing dynamics.
Specifically, we focused on long-distance moves (across counties, states or international borders) to capture more meaningful relocation decisions, rather than routine, local moves. We analyzed data through 2024, as it is the most recent year available from the U.S. Census Bureau. The mobility change from 2019 to 2024 is expressed in percentage points (pp), showing the difference between the share of owners and renters who moved in 2019 and the share who moved in 2024.
By 2024, renters were more mobile than homeowners in every city analyzed, moving at roughly 3.7 times the homeowner rate, on average. More than just a broad trend, this growing divide is the main trend shaping today’s housing market. In fact, 41 of the 100 largest cities saw owner mobility decline at the same time as renter mobility increased, marking the dominant pattern in U.S. housing market during that period.
Why 2019-2024? The 2019-2024 data captures the period when the owner-renter mobility gap widened, and that story still holds today: Mortgage rates remain above 6%, with no Fed relief in sight and rent growth has slowed to its weakest pace since 2020. In other words, owners are still facing the mortgage rate lock-in effect and affordability pressures, while renters are operating in a softer, more flexible market — reinforcing the trends highlighted in this study.
National Mobility Patterns Dominated by Locked-In Owners & Increasingly Mobile Renters
To better understand how these trends played out locally, we grouped cities into four distinct categories:
Cities where owner mobility decreased while renter mobility increased: In 41 large U.S. cities, homeowners grew less likely to move, held back by high mortgage rates and affordability challenges. At the same time, renters were on the move more often, responding to changing costs, new housing options and continued in-migration — widening the gap between the two groups.
Cities where both owner and renter mobility increased: In 23 markets, movement picked up across the board. These cities tended to attract new residents and offered conditions that made it easier for both renters and buyers to make a move.
Cities where both owner and renter mobility decreased: In 20 large cities, moving became harder for everyone. Limited supply, tough competition and broader economic pressures slowed relocation for both homeowners and renters, leading to a general cooling of housing activity.
Cities where owner mobility increased while renter mobility decreased: In 16 cities, improving conditions encouraged more homeowners to buy and relocate. Meanwhile, renters faced a steadier market, giving them fewer reasons to move frequently.
This framework highlights how national trends interact with local market conditions to shape mobility patterns across U.S. cities. Additionally, it’s worth noting that regional dynamics play an important role. For instance, markets that experienced strong pandemic-era migration — particularly in Florida and Texas — are now showing signs of cooling.
Locked-In Owners, On-the-Move Renters Drive Widest Mobility Gaps
The most common pattern across the 100 largest U.S. cities highlights a growing divide in the housing market: Homeowners are moving less, while renters are moving more often. Accordingly, in 41 cities, long-distance owner mobility fell, while renter mobility rose from 2019 to 2024.
The trend reflects housing markets in which the mortgage lock-in effect and affordability pressures are making homeownership — and upgrading — more difficult. At the same time, renters in these markets remained more mobile amid strong in-migration, new rental supply and shifting costs. This divide was especially pronounced across the South, where a large number of cities saw a significant divergence between hindered owner movement and increased renter mobility.
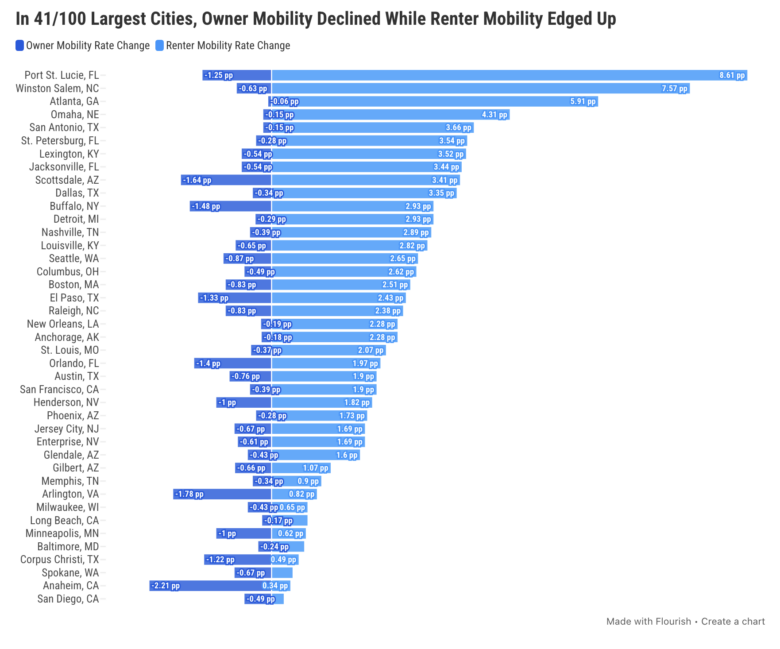
Port St. Lucie, Fla., recorded the sharpest owner-renter mobility divergence among the 100 largest cities. Its owner mobility rate fell by 1.25 pp between 2019 and 2024, while renter mobility jumped by 8.61 pp for the largest increase in long-distance renter migration among the country’s 100 largest cities.
The reversal was especially striking because Port St. Lucie was the only city in the U.S. where homeowners moved more than renters before the pandemic. By 2024, even that exception had collapsed. Rising mortgage rates and high property tax pressure weighed on homeowners. Meanwhile, a wave of new rental supply met growing demand from retirees and remote workers, giving renters more opportunities to relocate.
Other Florida cities followed the same pattern between 2019 and 2024. In Jacksonville, reports showed that homes were overvalued by 30%, which made it more challenging for owners to buy new properties. During the same period, the rise in build-to-rent completions expanded available options for tenants. So, as rental supply increased in a market with an already large renter base, renters had more room to move, even as owner turnover slowed.
Similarly, homeowner mobility also decreased in St. Petersburg, as rapid home price appreciation pushed the market into competitive territory that priced out buyers and reduced owner turnover. Meanwhile, rent growth began to cool from its post-pandemic highs, but renter mobility still rose because demand remained strong and tenants had slightly more flexibility to move than they did during the market’s most overheated phase.
In Winston-Salem, N.C., a $257,000 median home price and a $1,278 average rent made it one of the more affordable cities in the study — and renter mobility surged 7.57 percentage points, one of the largest increases among major U.S. cities. But even in this affordable market, the rate lock-in effect held: Homeowner mobility dipped slightly as existing homeowners had little incentive to give up low-rate mortgages.
Down in Georgia, Atlanta’s renter mobility also increased significantly (5.91 pp), while owner mobility slipped slightly. Here, renter demand remained strong during and and after the pandemic, as many suburban renters relocated to the city for job opportunities and a less expensive cost of living.
In the West, the same split was driven less by relative affordability and more by the high cost of ownership. Scottsdale, Ariz., saw one of the steepest owner mobility declines in the country — down 1.64 pp — while renter mobility rose by 3.41 pp. In this case, wealth migration, limited inventory and an influx of luxury buyers pushed the median sale price above $900,000, making ownership increasingly challenging even as the rental market remained active, with the average rent surpassing $2,000 per month.
Across-the-Board Mobility Gains Signal High-Demand, High-Opportunity Markets
In 23 markets, both homeowners and renters moved more between 2019 and 2024, signaling broadly favorable or fast-moving conditions. That’s because strong job growth, in-migration and expanding housing supply supported activity across both segments, thereby enabling greater flexibility for households to relocate, regardless of tenure.
It’s worth noting that, even in these markets, renter mobility increases outpaced owner mobility gains, further reinforcing the broader trend: Average increases for the 23 cities in this category reached 2.06 pp for renters, compared to 0.77 pp for homeowners.
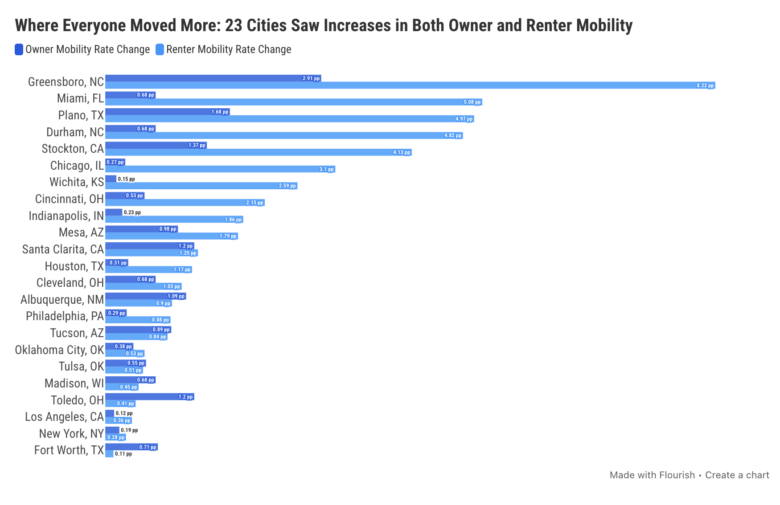
As an example, Greensboro, N.C., saw its renter mobility roughly double from pre-pandemic times (+8.22 pp) as population growth, a cost of living lower than the national average and $1,300 per month rent rates supported rental demand. The same factors also drove movement among owners as the city recorded the largest owner mobility increase (+2.91 pp) among the 100 cities in our dataset.
Moreover, Greensboro’s median sale price, which stood below the $300,000 mark, provided homeowners with relatively accessible entry points in the housing market, as well as more room to move without constraints.
Likewise, in Plano, Texas, both renter and owner mobilities went up between 2019 and 2024. Especially on the renter side, mobility increased 4.97 pp, reflecting the Dallas-Fort Worth region’s strong mix of job growth, in-migration and apartment construction. Meanwhile, owner mobility also edged up 1.68 pp.
Out West in Stockton, Calif., renter mobility rose by 4.13 pp, while homeowner mobility also increased by 1.37 pp, making it one of the clearest examples of a more active market. Notably, during the pandemic, Stockton absorbed spillover demand from the Bay Area as buyers and renters sought more accessible options, driving both home purchases and rental turnover.
On the opposite coast, a similar dynamic played out in Miami, Fla., where renter mobility increased by 5.08 pp, supported by strong in-migration and a highly competitive rental market during the pandemic years which pushed the average rent to almost $2,700 per month. Plus, limited supply and rapid population growth pushed rents higher, driving frequent renter turnover. At the same time, owner mobility also edged up by 0.68 pp as continued demand fueled by in-migration supported transaction activity, even as the market began to cool.
Staying on the East Coast, both renters and homeowners in Durham, N.C., became more mobile as the city’s economy continued to expand. More precisely, renter mobility rose by 4.82 pp, driven by population growth and increasing educational attainment tied to the Research Triangle. This steady inflow of residents supported both rental demand and homebuying activity, resulting in higher mobility across the board.
Chicago, Ill., also recorded rising mobility among both owners and renters, reflecting renewed urban demand. In particular, rental activity picked up, supported by stabilized rents and higher occupancy than the national average. However, in Chicago, stabilized rents didn’t indicate weak demand so much as a more workable market for tenants returning to the city after peak pandemic outflows. What’s more, rising homeowner mobility reflects continued in-migration into higher-income neighborhoods, as Chicago’s job opportunities and relative affordability compared to other coastal hubs support homebuying activity.
Slowing Housing Markets Stall Mobility for Both Owners & Renters
In a smaller group of 20 cities, both owner and renter mobility declined, pointing to broader slowdowns in housing activity where the mortgage lock-in effect and general financial pressures limited movement across the board.
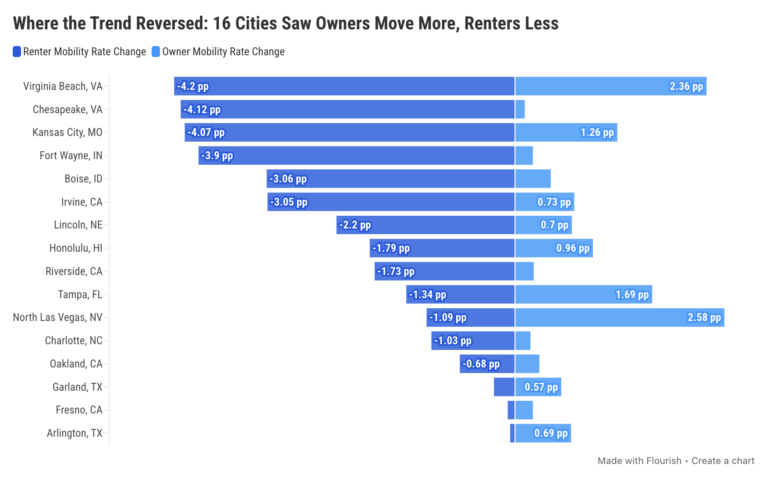
In Virginia Beach, Va., homeowner mobility rose by 2.36 pp, likely driven by demand surrounding its military sector, while renter mobility fell by 4.20 pp. Its relatively stable housing market — where the median sale price aligned with the national average of $400,000 — helped keep ownership attainable and supported transaction activity.
Virginia Beach also illustrates how additional rental supply could reduce renter turnover when demand cools. Specifically, as post-pandemic inventory growth raised vacancy and eased competition, renters had fewer reasons to move, even as the ownership side remained relatively active.
Kansas City, Mo., was another large urban center where owner mobility increased (1.26 pp), even as renter mobility declined (4.07 pp), reflecting diverging conditions between tenure types. The Kansas City housing market remained relatively active, supported by a moderate median sale price of $258,000 and sustained demand, which allowed buyers and sellers to make transactions more freely than they could have in higher-cost markets.
That said, a slowdown in rent growth year-over-year, along with rents hovering around a relatively affordable $1,300 per month, reduced the pressure for renters to move and consequently contributed to lower renter mobility.
At the same time, homeowner mobility increased by a notable 2.58 pp in North Las Vegas, Nev., while renter mobility fell 1.09 pp. According to the U.S. Department of Housing and Urban Development (HUD), North Las Vegas was the fastest-growing city in its metro, and the overall owner-household growth averaged 2.3% per year since 2020. But, renter-household growth slowed, hindering mobility among tenants.
In Irvine, Calif., the same pattern was driven by tight, expensive coastal markets and the luxury segment. Irvine, in particular, reached a median sale price of more than $1.6 million, appealing to wealthier buyers who are less likely to be deterred by rising mortgage rates or socioeconomic factors that tend to keep most buyers locked in. Additionally, elevated rents of almost $3,300 per month and a competitive market may have reduced turnover among renters as tenants opted to stay in place, rather than face higher costs elsewhere.
A Divide That May Outlast Rate Cuts
The most important story in migration and mobility in recent years is the growing split between owners and renters. As mortgage rates climbed and home prices stayed high, more owners were locked in, while renters remained the more mobile group.
Granted, that gap could narrow somewhat if mortgage rates ease, giving more owners a reason to sell and move. But, unless conditions improve more broadly — through lower prices, more inventory or both — the divide is unlikely to disappear in the near future. In other words, lower rates may loosen the market, but they’re unlikely to fully reverse the trend on their own.
Click here to see the full dataset.
Related:
- $4.6M Hudson Yards Maintains Top Spot, Luxury Sales in Malba Set $2.5M Price Record for Queens
- 2026 Q1 Foreclosure Report: Brooklyn Filings Fall Sharply, Bronx & Staten Island Hit New Peaks
Like MediaFeed’s content? Be sure to follow us.
This article originally appeared on Propertyshark.com and was syndicated by MediaFeed.co.