New Yorkers planning a move to the suburbs increasingly find their options limited, after suburban home values shot up twice as fast as NYC medians over the last decade. While larger homes and better prices were long the norm outside the five boroughs, today, many NYC buyers find their option restricted to a handful of suburban markets.
Key Takeaways:
- Suburban median sale price surges 86% between 2016 and 2025, double NYC’s gains
- Median sale prices doubled or more across 100 suburban communities since 2016
- Buyers from lower-priced neighborhoods can no longer afford most suburban markets: No markets left below $250,000, only 8% remain below $500,000
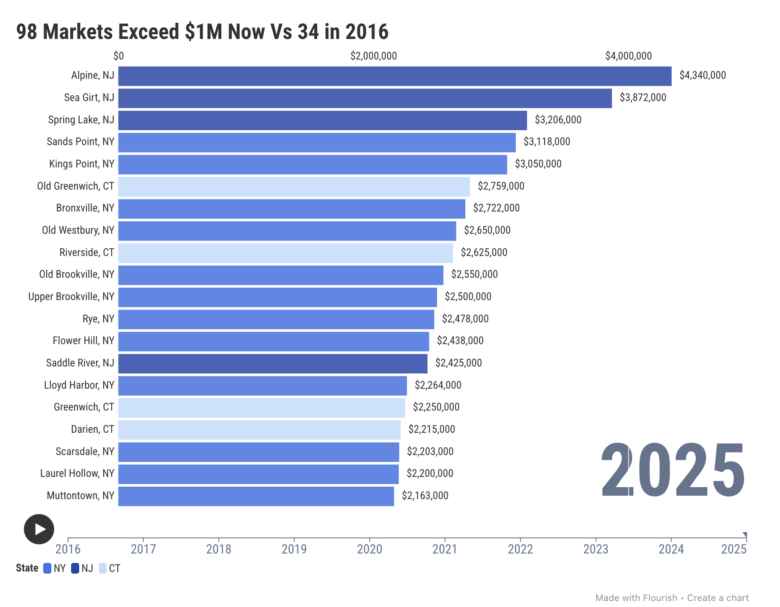
- 1 in 4 suburban markets now sit at $1 million and above, up from 1 in 10 a decade ago
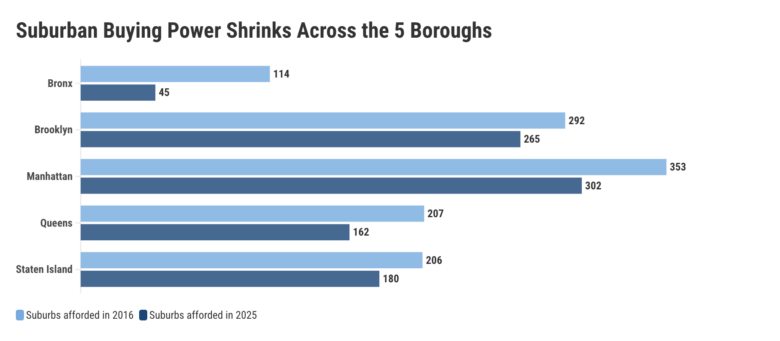
- Top NYC budgets no longer cover the entire suburban ring: Manhattan’s buying power drops from 91% of suburbs to 78%, Brooklyn’s shrinks from 75% to 68%
- Staten Island buyers retained more suburban access than Queens: 46% versus 41%, compared to 53% a decade ago
- 14 Bronx and Queens NYC neighborhoods cost less than even the region’s cheapest suburb
During the last decade, NYC suburbs have undergone a fundamental repricing, moving dramatically upward: While the NYC median sale price rose 43% and the national median sale price jumped around 75% between 2016 and 2025, NYC’s suburbs shot up 86% during the same period.
Sales data for the 13-county NYC suburban region shows that a staggering number of suburban communities have surpassed NYC neighborhoods in pricing. Now, formerly affordable suburbs of NYC sport prices that were previously exclusive to the most expensive NYC suburbs.
Consequently, what was once a suburban ecosystem with a wide range of price points in which NYC buyers could still find relatively affordable communities has since consolidated into a far more expensive market dominated by mid- and high-priced suburban communities. That effectively eliminated the traditional starter home markets familiar to NYC buyers: Today, only 31 enclaves sit below $500,000, representing just 8% of the 387 suburban markets in this study.
Starter Markets Gone, Luxury Markets Surge
Shrinking Options for NYC Buyers: Fewer Than 1 in 10 Suburban Markets Below $500K
Suburban price growth has not only outpaced NYC gains in the last decade but also reshaped the region’s housing hierarchy in ways that directly affect NYC buyers. As prices climbed across nearly every suburban market, the advantage long held by city buyers — the ability to trade up for more space at lower cost — has narrowed significantly.
Thus, rather than being limited to a handful of high-end enclaves, price increases spread across the suburban ring, pushing entire segments of the market into higher tiers. Accordingly, affordable NYC suburbs that once served as entry points for NYC buyers have steadily moved out of reach, forcing buyers from the city to adjust expectations or budgets.
In fact, today, 43% of suburban markets are priced between $500,000 and $750,000 — double their share from a decade ago — while 49% of markets now exceed $750,000. At the same time, the number of $1 million markets has surged to nearly 100 and sub-$250,000 have fully disappeared. This evolution reflects a structural change: The suburbs outside of NYC have moved up the pricing ladder, removing many of the lower-cost options that NYC buyers once relied upon.
Notably, this trend accelerated sharply during the pandemic as lockdowns and widespread remote work motivated many would-be buyers to leave the city — raising prices far beyond the boundaries of the city. And, while price growth has slowed somewhat post-COVID, it remains ongoing with suburban home prices rising 5% in 2025 alone.
Pre-Pandemic Evolution
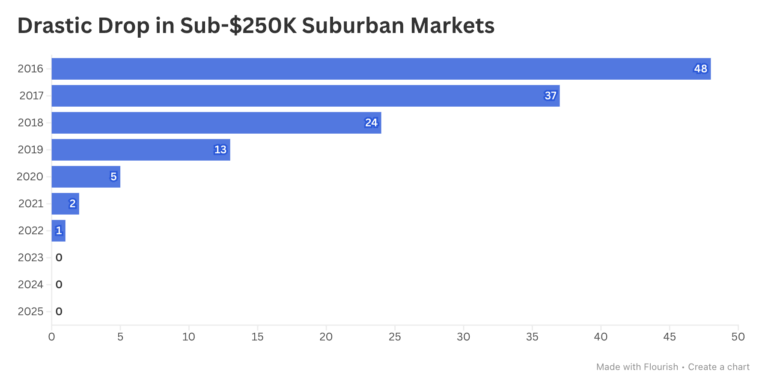
1 in 10 Suburban Markets Were Below $250K Just 1 Decade Ago
In 2016, NYC buyers could access a wide range of entry-level suburban markets with 61% of towns priced below $500,000 and 12% below $250,000. Specifically, communities like Asbury Park and Carteret offered sub-$250,000 entry points, while places like Shelton and Ridgefield Park formed a broad middle tier.
By 2019, that structure had already begun to shift: The number of sub-$250,000 markets dropped from 48 to 13, reducing their share from 12% to 3%. Many of these towns moved into the $250,000 to $500,000 range, shrinking the lowest-cost segment that had anchored affordability for NYC buyers.
At the same time, price growth spread across the region, rather than remaining isolated. Namely, markets that once defined the lower tier moved upward, further tightening the range of options available at entry-level price points.
Suburbs that had provided a critical on-ramp for first-time buyers and middle-income households looking to move out of the city and offered many NYC households their first realistic pathway into homeownership had nearly vanished, as places like Hackensack and Newark underwent rapid price growth.
Even as this happened, the suburban market still largely functioned as a middle-tier environment with more than 79% of towns remaining between $250,000 and $750,000. But the direction of change was clear — fewer low-cost markets and increasing pressure on the lower end. What’s more, these changes occurred even as prices contracted in a portion of suburban NYC, likely also influenced by the 2017 Tax Cuts and Jobs Act, which capped SALT deductions at $10,000 per household.
Pandemic Tipping Point
Sub-$250K Markets Vanish, Only 1 in 4 Suburbs Remain Below $500K
Then, the pandemic reversed any ongoing pricing downtrends and supercharged price acceleration curves, rapidly pushing suburban markets into higher price tiers. And, as demand surged and supply tightened, NYC buyers faced increasing competition for homes outside of the city. That drove up prices across the region, forcing many city dwellers to target wealthier NYC suburbs or look farther from the city.
By 2022, sub-$250,000 markets had effectively vanished with the exception of Bridgeport, which squeezed in just below this pricing threshold. As a matter of fact, the majority of the 48 communities still below $250,000 in 2016 had moved well into the $300,000 and $400,000 price territory while others — including Highlands and Island Park — actually surpassed the half-million mark.
The collapse of the sub-$250,000 segment effectively closed off the suburbs to buyers looking to move from NYC’s lowest-priced neighborhoods to the suburbs, an avenue that had remained open just a few years prior. At the same time, the share of markets below $500,000 fell to 28% — less than half the share it represented just six years earlier — increasing suburban competition among middle-income NYC buyers.
Meanwhile, growth concentrated in higher price brackets. In particular, suburbs in the $500,000-to-$750,000 tier expanded to include 38% of markets to become the largest segment, comprising 147 communities contained, including Amityville and Milltown. Similarly, the number of towns above $750,000 more than doubled compared to 2016 to include 131 communities, 62 of which had surpassed the million-dollar mark.
This evolution reflected the reordering of the suburban market. Communities that had once been attainable for NYC buyers moved into mid- and upper-tier pricing, raising the baseline cost of entry. With that, the pandemic marked a turning point for NYC buyers eyeing suburbia: Affordability constraints were no longer limited to select markets, but rather became a defining feature across much of the suburban region.
Post-Pandemic New Normal
Only 8% of Suburbs Below $500K, 1 in 10 Surpass $1M
By 2025, the upward shift had become even more pronounced, leaving NYC buyers with far fewer suburban markets at lower price points than there were a decade earlier. More precisely, zero suburban markets remained below $250,000 and only 31 towns — 8% of the region — were priced between $250,000 and $500,000.
Instead, the market concentrated at higher price levels: Communities in the $500,000-to-$750,000 range came to account for 43% of the options for NYC buyers, while 49% of markets exceeded $750,000. At the upper end, 98 of the most expensive NYC suburbs reached median sale prices above $1 million.
This expansion included both long-established, high-end markets — such as Scarsdale and Greenwich — as well as towns that had shifted upward throughout the last decade. For example, Maplewood had moved from less than $500,000 in 2016 to more than $1 million in a reflection of sustained demand for transit-accessible suburban communities — the types of markets that many NYC buyers now compete for as affordable suburban options continue to shrink.
For NYC buyers, this new structure means fewer pathways into suburban homeownership. In fact, the entry-level segment has largely disappeared. What was once the dominant price tier has become increasingly rare, significantly limiting the number of suburban markets where NYC buyers can still find relatively attainable home prices.
Nowadays, moving from the city to the suburbs no longer guarantees greater affordability for New Yorkers. Rather, it often requires would-be buyers to compete at higher price tiers across a much smaller pool of attainable communities.
What The NYC Buyer Can Afford
What Can You Buy & What Are You Competing With?
Despite gaining spending power on paper, New Yorkers looking to move beyond the five boroughs have lost significant ground across the suburban landscape as it increasingly competes with city prices. So, for many NYC buyers today, the move to suburbia is less about trading the city lifestyle for more space and more about which suburban markets still fall within the price range of their neighborhood — and how many have already outpriced them.
Back in 2016, the city’s median sale price of $559,000 allowed New Yorkers to buy in 262 communities or 68% of the suburban market. By 2025, the citywide median had climbed to $800,000, but that higher price point could cover only 217 communities (or 56% of the regional market) as suburban home prices increased at a sharper rate, from the most affordable to the wealthiest NYC suburbs.
Essentially, while many NYC neighborhoods’ home prices lined up comfortably with large portions of the suburban housing market just a decade ago, the same neighborhoods reach fewer suburban communities today.
For example, in 2016, even buyers from the cheapest NYC neighborhood could theoretically afford to move outside the five boroughs: Parkchester’s $116,000 median sale price covered five of NYC’s most affordable suburbs. But now, that balance has tipped to the other direction as homeowners in 14 Bronx and Queens neighborhoods find themselves priced out of even the cheapest suburb — the $335,000 Bridgeport.
The Bronx
From Limited Access to Near Exclusion
Beyond Parkchester, the Bronx presents one of the most dramatic cases for how sharply the balance between city and suburb has shifted. That’s because the borough’s median sale price increased by more than half in the last decade to reach $520,000, yet the number of suburban markets within reach dropped from 114 to 45. As a result, a Bronx owner looking to move to the suburbs can now afford just one in 10 markets, down from one in three previously.
In fact, buyers from the city’s lowest-priced neighborhoods — including 11 Bronx locations — have effectively lost access to NYC’s traditional suburban region. For instance, Norwood could still compete in Asbury Park in 2016. However, single-digit price growth brought Norwood to a more modest $245,000 median sale price and suburban reach disappeared entirely.
Similarly, Plainfield and Newark were within the price range of Fordham buyers a decade ago, but moved well beyond that price point despite Fordham’s 45% median sale price increase.
Nearby, Riverdale maintained access (but just barely) as affordable NYC suburbs collapsed from 111 locations to just three. Once enough to cover Englewood or Saddle Brook, Riverdale’s current $372,000 price point now only reaches Helmetta, Bridgeport and Hackensack.
Notably, higher-priced Bronx neighborhoods retained more flexibility, though still less than before. For example, in Pelham Gardens, the median advanced 56% to $780,000 over the last 10 years, but suburban reach fell from 242 locations to 214 and shifted from places like Fort Lee to Mendham or Bayville.
Manhattan
Still Broad Reach, Noticeable Contraction
Manhattan continues to hold the region’s highest prices, but, even here, suburban reach has narrowed. In 2016, Manhattan’s million-dollar median sale price could buy a home in 353 suburban communities or roughly 91% of the market. By 2025, Manhattan’s median sale price appreciated to $1.13 million, but residents’ buying power fell to 302 locations or about 78% of suburban communities.
This narrowing of Manhattan’s suburban buying power can be tracked across the borough’s price range. One of Manhattan’s most extreme cases is Inwood, which, a decade ago, could still afford 39% of suburban markets, including Norwalk. Today, buyers looking to trade Inwood for suburbia can realistically cover only eight locations, such as West Milford and New Brunswick.
In the same way, New Yorkers looking to trade Harlem for the suburbs have also seen their options collapse from nearly 300 locations — including New Rochelle — to just more than 150 communities like Cliffside Park.
Meanwhile, the Lower East Side’s pricing stability proved to be a disadvantage to residents looking to move beyond the five boroughs: Its reachable suburbs fell from 332 to 217, shifting from options like Pound Ridge to Upper Freehold.
Otherwise, at the top of the borough, suburban reach remained nearly universal, although even SoHo’s buying power shifted. While the iconic neighborhood’s median sale price climbed 12% to $3.8 million, this price point puts the region’s top two markets out of reach even though a decade ago, SoHo buyers could afford 1.5 Alpine homes and two in Sea Girt.
Brooklyn
More Price Growth, Less Suburban Reach
Brooklyn’s median sale price increased sharply from $636,000 in 2016 to $925,000 in 2025. Despite that gain, the number of suburban towns priced at or below that level declined from 292 towns to 265 in one of the less dramatic changes in access among the five boroughs.
So, while buyers leaving the borough still command strong purchasing power, many suburbs that once fell comfortably within reach have moved into higher price brackets and may soon be out of reach. And, with Brooklyn’s housing market priced near the suburban middle, its neighborhoods showcase how the suburban tradeoff has tightened across NYC’s mid-priced spectrum.
On the more dramatic end sits Sheepshead Bay, which saw suburban option drop from 109 locations in 2016 to just 13 today, even as its median sale price increased by nearly half. For comparison, a decade ago, that price point could compete in Mount Olive or Stony Point. Today, it reaches faraway Danbury or Netcong.
Buyers leaving Bay Ridge in 2016 could comfortably choose from 242 suburban enclaves, including Fort Lee and Ramsey. Today, they have 98 fewer options, despite a 31% median sale price increase to $656,000.
At the higher end of Brooklyn’s real estate market, reach remained broad but still tightened somewhat. For instance, Park Slope buyers’ $1.47 million budget keeps suburban reach wide with markets like New Castle and Monmouth Beach and Southport wide open, but lost a handful of locations such as Cos Cob.
Queens
Shrinking Access Across the Middle
Queens shows perhaps the clearest shift in how suburban access has tightened for typical NYC homeowners. That’s because Queens’ median sale price rose from $435,000 to $680,000 in the last decade, yet the number of suburban markets accessible at that level fell from 207 to 162, consequently falling from more than half of the suburban ring to just two out of every five locations.
One of the borough’s most drastic cases was Jackson Heights, where suburban reach collapsed from 114 towns to just four. Specifically, in 2016, a Jackson Heights home could be traded for a home in Fairview, or Hawthorne, whereas today it barely covers Keansburg.
Likewise, Forest Hills residents saw a similar collapse of options. Its current median sale price provides access to just eight markets that include West Milford. But, a decade ago, 125 locations were open to it, including Dumont and Totowa.
Meanwhile, buyers looking to leave Old Astoria and the city can still choose from half of the region’s 387 suburban markets, including Long Branch and Port Chester. That said, in 2016, only one-quarter of suburbs were out of reach, and viable options also included White Plains.
Further up the ladder, reach remained strong, but a handful of options still slipped away. For example, Malba’s median sale price jumped 67% to $1.53 million, maintaining high suburban reach. 343 markets remain open to Malbans leaving the city, including North Castle, yet five suburbs still fled Malba’s reach, including Chatham.
Staten Island
Close to Suburbs, Still Losing Ground
In Staten Island, prices increased from $431,000 to $710,000 during the last decade. Because Staten Island housing already sat closer to suburban pricing and followed sharp price gains, buyers here maintained much of their reach, but still saw it narrow from 206 available markets to 180.
As a result, the fifth borough’s reach slipped from roughly 53% of suburban communities to about 47%, as markets across Northern and Central New Jersey, Long Island and the Hudson Valley moved upward at the same time.
Heartland Village residents saw one of the most drastic drops in options among Staten Island neighborhoods, despite meaningful price increases. A decade ago, Heartland Village homeowners could trade their home for one of 63 suburbs. Today, only nine markets remain within price range. So, while 2016 still left the road open to Mount Arlington or Neptune, options nowadays look more like Riverdale.
Similarly, homeowners looking to trade Dongan Hills for the suburbs also have noticeably fewer options. A decade ago, they could choose from half of suburban markets, including places like Cedar Grove and Cranford. Today just over one third remain open, shifting to areas like Springfield.
At the borough’s upper price tiers and with strong price growth, Todt Hill’s $1.18 million median sale price kept 308 markets open (such as Hohokus and Ridgewood), but 30 suburbs moved beyond its price range, including Garden City.
Conclusions
NYC’s New Mid-Six & Seven-Figure Suburbia
In the last decade, NYC’s suburban housing market has shifted structurally: Communities that once made up the affordable and mid-priced tiers have moved into higher brackets, leaving a suburban market now centered on mid-six- and seven-figure home prices.
Consequently, that shift has materially changed the suburban equation for NYC buyers: Entry-level markets that once extended purchasing power beyond the five boroughs have largely disappeared. Mid-market buyers still have access, but across a smaller share of suburbs than a decade ago. It’s only at the highest price points that the broad suburban reach that once defined the move out of the city still holds — although, even there, it’s tightening.
With the bottom tier nearly gone, the remaining foothold is narrow. Without a meaningful increase in supply, the 8% of markets still priced below $500,000 represent the last entry points for NYC buyers seeking suburban access — and prices are still rising.
For more information, explore the evolution of home prices across NYC’s suburbs over the past decade in the interactive table.
Methodology
To determine the home price evolution of NYC’s suburbs, we analyzed residential transactions registered between January 1, 2016 and December 31, 2025, taking into account sales of single and two-family homes, condos and co-ops, excluding all multi-parcel deals. Median sale prices were rounded to the nearest $1,000.
For an accurate representation of on-the-ground dynamics, median sale prices and median sale price changes were calculated only for locations that logged a minimum of 15 annual sales in each of the ten years included in this study, resulting in 387 suburban communities.
Suburban NYC was defined as the following 13 counties: Bergen County, Essex County, Fairfield County, Hudson County, Middlesex County, Monmouth County, Morris County, Nassau County, Passaic County, Rockland County, Suffolk County (excluding the Hamptons and the North Fork), Union County and Westchester County.
Timeframes were defined as:
- Pre-pandemic period: 2016-2019
- Pandemic: 2020-2022
- Post-pandemic period: 2023-2025
Related:
Like MediaFeed’s content? Be sure to follow us.
This article originally appeared on Propertyshark.com and was syndicated by MediaFeed.co