
Profiling NYC homebuyers in 2025 based on financing, buyer origin and location, plus ownership type shows a city split by cash, credit, borough loyalties and buyer identity.
Key Takeaways:
- NYC buyers were nearly evenly split between cash and mortgage purchases, with cash dominating Manhattan and mortgages defining the outer boroughs.
- In the Bronx and Queens, mortgage-backed buyers paid higher median prices than cash buyers, a sign of local demand versus investor activity.
- Staten Island stood out as NYC’s most mortgage-reliant and locally rooted market, with 77% of buyers using financing and 97% staying in-borough.
- LLCs made up over 1 in 10 home purchases citywide, heavily concentrated in high-end Manhattan neighborhoods.
- Cash buyers were most active at the ends of the market, dominating sub-$250K sales and homes priced above $5 million.
- Solo women surpassed solo men as buyers in 2025 — but family-based purchases declined, reflecting a shift toward individual and structured ownership.
- Most NYC buyers were local, and the majority stayed within their home borough — except in Brooklyn, where many crossed into Staten Island.
- Trust and REO sales doubled up to 4% of all deals in the past decade, signaling a subtle, but clear increase in estate transfers and institutional ownership.
Behind every home sale in NYC is a buyer — and in 2025, who’s buying depends on where they are, how they pay and what kind of stake they’re taking in the city.
Some bring cash, buying through LLCs in high-priced Manhattan buildings. Others rely on mortgages to buy homes in the outer boroughs where financing remains essential. Based on residential sales from the first five months of the year, these patterns reflect more than income — they signal intent, identity and access.
The NYC ownership landscape is shifting: Family purchases are slowly declining, while women are quietly getting ahead as individual buyers. And in dozens of neighborhoods, cash deals are closing above local median sale prices, a discreet sign of concentrated wealth and investment pressure.
Overall, there is no single NYC buyer. But together, their decisions offer a detailed look at who’s buying into the city right now — and how those choices are reshaping ownership across the five boroughs.
Who’s Paying Cash, Who’s Taking Mortgages, Who’s Hiding Behind an LLC
In the first five months of the year 56% of NYC homes were purchased with a mortgage — a slim majority driven largely by trends outside of Manhattan where cash remains king. In fact, 60% of all Manhattan sales closed without financing, the highest share citywide.
That figure matters not only because Manhattan accounted for more than one third of all residential transactions in the city, but also because it illustrates how concentrated wealth and liquidity can reshape ownership patterns. Otherwise, The Bronx was the second-most cash-reliant market after Manhattan, with 40% of homes sold without financing, likely reflecting investor activity in its lower price tiers.
Meanwhile, in the rest of the city, financing remains critical. Staten Island was the most mortgage-heavy borough, with 77% of buyers using loans, while Queens and Brooklyn sat between these extremes with roughly one in three sales closing in cash.
Price Gaps Reflect Buyer Behavior
The cash versus mortgage split is also a proxy for buyer type, not just a matter of preference. Cash buyers tend to be investors and high-net-worth individuals looking for speed and negotiating power. Mortgage-backed buyers are typically end users: First-time buyers, families or long-term residents purchasing primary homes rather than investment properties.
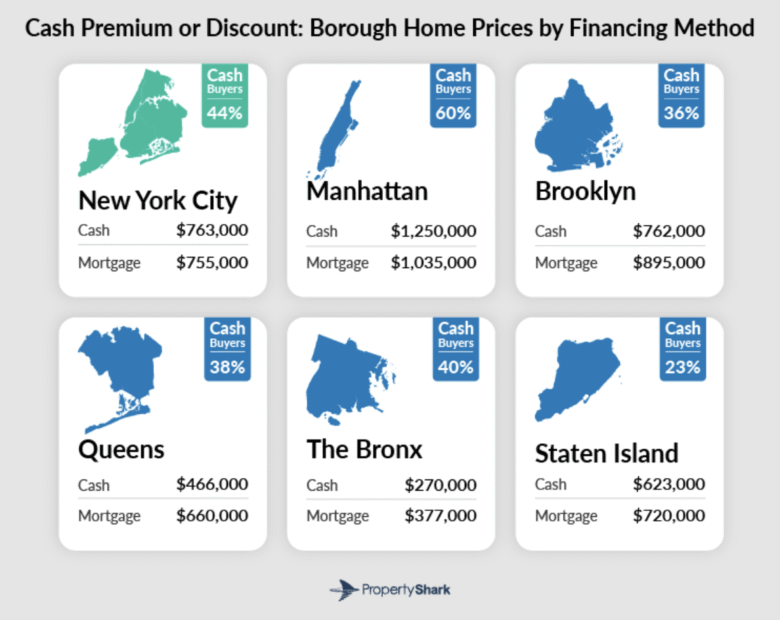
And that divergence shows up in pricing. In Manhattan, median prices for cash sales hit $1.25 million — $215,000 higher than mortgage-backed sales. In outer boroughs like the Bronx and Queens, the opposite holds: Mortgage deals here tended to fetch higher prices, signaling that most of these buyers are looking to become residents and less so investors. For example, in the Bronx, mortgaged homes sold for a median $377,000 compared to $270,000 for cash — a gap that underscores the investment focus of many cash buyers there.
Cash at the Extremes, Mortgages in the Middle
Price band data reinforces this divide. Cash dominates pricing extremes, with 60% of homes under $250,000 and nearly two-thirds of sales above $5 million signed as all-cash deals. Mortgages clustered in the middle, especially between $500,000 and $1 million, the range where local buyers tend to be most active.
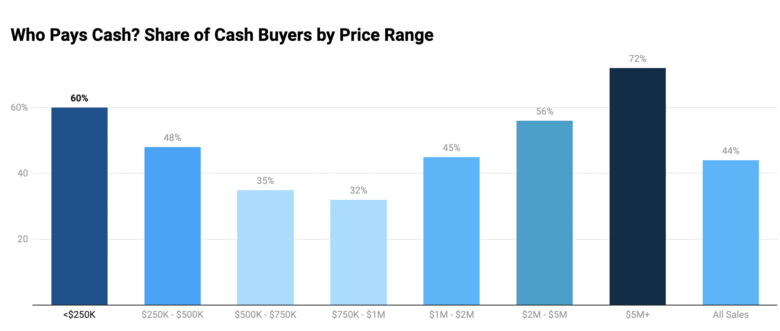
In 2025, two-thirds of homes between $500,000 and $1 million were financed, highlighting the overall affordability pressures pushing most local buyers toward mortgages. Cash buyers, meanwhile, operate strategically at the top and bottom — either to compete for luxury properties or to quickly secure low-cost investments, often using LLCs, a common ownership structure among investors and high-net-worth individuals. .
Unsurprisingly, Manhattan continues to dominate LLC activity, accounting for nearly half of all such sales citywide. That aligns with its outsized share of cash purchases and high-end transactions, where LLCs are frequently used to acquire luxury or investment-grade properties discreetly.
Hotspots, High-Income Pockets, Investment & Gentrification
Citywide, 61 neighborhoods saw at least half of all 2025 sales close in cash. Manhattan led by far, but these cash-heavy zones appeared in every borough, often revealing where capital is flowing.
Of these, five neighborhoods crossed the 75% cash threshold. These included global capital hubs like NoHo (93%) and Central Park South (85%), alongside enclaves like Breezy Point (100%) and Glen Oaks (85%) in Queens. These pairings suggest two cash buyer types: High-net-worth investors and longstanding local owners buying without financing. They can also highlight accelerating price growth in gentrifying markets.
One Trend, Many Motivations: Mapping NYC’s All-Cash Buyers
All-cash sales continue to play a significant role across NYC: Across 68 neighborhoods, the median sale price paid by cash buyers exceeded the area’s overall price. But what they represent varies dramatically by neighborhood. In some of NYC’s most competitive markets, cash deals signal speed, purchasing power and cash buyers’ preference for higher-end homes.
For example, in the West Village, the median cash price reached $2.27 million — $462,000 above the neighborhood’s overall price. In Hudson Yards, that gap soared to nearly $2 million. Similar trends showed up in TriBeCa, Chelsea and Prospect Heights, where cash deals consistently signed at higher price points, suggesting that cash buyers are using liquidity to stake claims in prized or fast-appreciating areas.
In Queens, the share of cash buyers passed 50% in 11 neighborhoods, including Glen Oaks (84%) and Downtown Flushing (53%). But here, cash was often tied to lower price points signaling community capital rather than investment pressure. Glen Oaks, for example, had a median sale price of just $360,000.
The Bronx told yet another story. Here, eight neighborhoods passed the 50% cash mark, mostly in areas with median prices below $300,000, suggesting a mix of investor buyers, distressed sales and limited mortgage access.
As is often the case with the fifth borough, Staten Island stood apart. No neighborhood passed the 50% threshold — a reflection of its deeply mortgage-reliant market. Still, pockets like Prince’s Bay and Rossville recorded cash premiums, hinting at small-scale investor demand and new residents flowing in from pricier boroughs like Brooklyn.
Where They’re Growing, What They’re Targeting & Why It Matters
LLCs accounted for 11.35% of all NYC home purchases in 2025 — a small but influential share that reveals another layer of ownership in the city’s landscape. Currently, LLC buyers are largely cash-based and most active in high-end or appreciating markets with attractive investment margins.
Manhattan continues to lead, with LLCs behind nearly half of all entity-structured deals. In neighborhoods like NoHo, LLCs made up 60% of sales — matching the area’s cash-heavy, high-price profile. Similarly, neighborhoods like TriBeCa, NoHo and Gramercy Park also saw LLC use spike over the past 10 years. As a result, corporate entities now make up over a quarter of buyers in Gramercy Park (27%) and TriBeCa (29%), whereas in NoHo, LLCs accounted for 60% of buyers in early 2025.
These patterns reflect strategic ownership: Privacy, legal insulation and long-term positioning matter as much as location. They also show how institutional-style structures are gaining traction among high-net-worth buyers.
A Small, but Growing Footprint in a Competitive Market
In the Bronx, the story shifts. Parkchester LLC purchases tripled since 2015 to now represent 34% of sales — a signal not of luxury positioning, but of investor targeting. Here, LLCs are likely used for bulk buying, flips or distressed acquisitions, capitalizing on relatively low entry prices as the neighborhood shifts into gentrification.
At the same time, Brooklyn and Queens showed more gradual LLC growth. In neighborhoods like Sheepshead Bay, Kew Gardens Hills and Fresh Meadows, LLC use increased modestly, suggesting small-scale investors and multigenerational ownership structuring.
Overall, LLC ownership remains a minority, but its footprint is expanding in ways that mirror where cash concentrates and competition tightens. Whether in luxury corridors or low-cost flips, these structured buyers are redrawing the map of who owns and why.
Buyer Type Hints at Ownership Trends
Examining who is actually buying NYC real estate reveals demographic shifts and the increasingly complex nature of ownership itself, offering insights to the people or entities behind the deals.
In the first five months of 2025, family-based acquisitions accounted for 46% of all residential sales across the city — down from 50% a decade earlier. While still the single largest category, the downtick in family-based acquisitions suggests a market that’s subtly shifting from traditional household-based buying.
In parallel, purchases by individual women inched up from 18% to 20% of all sales, with men following closely behind at 19%. On the surface, these gendered splits look balanced. But compared to NYC’s population makeup — 52% female, 48% male, per U.S. Census data — it reveals that women are still underrepresented as property owners.
Strategic Buyers Quietly Expanding Footprint
Meanwhile, institutional and non-individual buyers quietly gained ground. Sales filed under LLCs remained stable at 11%, but trust and real estate-owned (REO) purchases climbed from 2% to 4% of all transactions. Although still a minority share, this growth is significant, especially as trusts are often used for estate planning, intergenerational wealth transfers and shielding ownership from public view.
Taken together, these trends point to a gradual shift in how ownership is structured, with a small but growing share of sales involving buyers who prioritize privacy, estate planning and asset protection.
Where They’re Coming From: Buyer Origin by Borough & Beyond
While 87% of NYC homebuyers are local, the market is far from insular. Instead, purchasing patterns reflect a dynamic mix of inter-borough moves, statewide demand and a spread of out-of-state buyers — with a small but suggestive layer of international activity at the margins.
Inter-Borough Moves Dominate, but Not Equally
Most buyers stayed close to home in the five boroughs, but not all parts of the city behaved the same. For instance, Staten Islanders were the most insular of all: 97% remained within the borough with negligible outflow to the other four boroughs. Queens residents were also highly stationary as 95% purchased in-borough, with a small minority buying Manhattan homes.
Brooklyn stood out as the most fluid. While 77% of buyers stayed in Brooklyn, about one in eight bought in Staten Island — the highest inter-borough movement in the city. That trend likely reflects space-seeking and affordability-driven shifts across the Narrows.
Meanwhile, Manhattanites remained highly rooted as 94% bought within their own borough with only limited movement toward Brooklyn or Queens. Buyers with Bronx residences matched Manhattan’s in-borough home purchases at 94%. Notably though, 3% of buyers from the Bronx picked up homes in Manhattan and another 3% in Queens.
Overall, borough-based loyalty shaped most transactions. New Yorker buyers, it seems, tend to know what they want — and where.
Buyers From Outside NYC: Suburban Strength, Regional Pull
Beyond the city, most demand came from elsewhere in New York State: 4% of sales in the first five months of the year were signed by in-state buyers, clustered most from Long Island and Westchester County.
Great Neck led the list with 57 buyers coming from here, followed by Roslyn, White Plains and Manhasset with 16 buyers each, plus Scarsdale and Yonkers with 11 residents — all affluent suburbs with strong economic and personal ties to the city. These buyers likely include long-time suburban residents maintaining a foothold in NYC, as well as returning former residents and investors.
However, demand dropped sharply further upstate: Towns like Buffalo, Albany and Saratoga Springs produced just one or two buyers each, reinforcing the domination of metro-adjacent markets.
Out-of-State Buyers: A Bi-Coastal & Tri-State Story
Buyers from outside New York State made up 8% of buyers, but out-of-state buyers were a more dispersed segment. As expected, New Jersey led by a wide margin, accounting for 2% of buyers, followed by California, Florida and Connecticut, with each supplying 1% of NYC buyers in early 2025. The mix suggests a combination of investors, dual-residence owners and regional movers seeking long-term value or lifestyle flexibility.
California’s strong presence (184 buyers) points to bi-coastal mobility, likely among higher-income households. Florida (141 buyers) and Connecticut (98 buyers) saw modest but steady volumes, perhaps reflecting returning New Yorkers or investment buyers seeking diversification. Beyond these, nearly every state and territory contributed at least one buyer: From Massachusetts to Mississippi and Hawaii to North Dakota, the reach was wide, even if the counts were low.
Foreign Buyers: Likely Understated, but Still Active
Officially, only 44 residential purchases were recorded to foreign buyers in early 2025 — a slim share of the market. But the true figure is likely far higher: Many international buyers structure their purchases through local LLCs, legal representatives or U.S.-based family members, obscuring their presence in official records.
Still, the limited available data shows interest from countries with long-standing ties to NYC real estate, including the United Kingdom, Israel, Japan, Canada and Italy. These buyers may represent just a sliver of total transactions — but they’re strategically positioned.
Conclusions
Who’s Buying NYC Right Now & What It Reveals About the Market
NYC’s residential market in early 2025 shows a city divided more by financing type and ownership structure than by broad market shifts. Mortgage-backed purchases still make up the majority, particularly in Staten Island, Queens, and the Bronx — where local buyers stretch to meet rising prices. Meanwhile, cash remains dominant in Manhattan and at the high-end and low-cost edges of the market.
LLC buyers, while still a minority, play an outsized role in shaping ownership in select neighborhoods, often aligning with cash and premium pricing. At the same time, family-based purchases have declined, as solo buyers — particularly women — are becoming more visible in the data. Most buyers remain local, and most continue to buy in-borough, but exceptions like Brooklyn-to-Staten Island moves hint at affordability-driven shifts.
Rather than a single trend, the overall picture points to parallel buyer patterns playing out across boroughs, budgets and buyer types. ,Ownership in NYC today is not monolithic: It’s layered, uneven and increasingly defined by how people buy as much as where. You can check 2025 Home Sales Borough & Neighborhood Snapshot here.
Methodology
To determine NYC buyer types, we extracted all residential property sales recorded in ACRIS and the Richmond County Register between January 1, 2025, and May 31, 2025.
To determine whether a sale involved a mortgage, we researched if any mortgage documents were recorded on the same day as or following the deed recordation, also researching mortgage documents by the buyer’s name.
Buyer location was determined based on the address listed by the registered owner. For purchases made under an LLC, we used the address of the contact person (the real owner).
The gender and ownership-type breakdown was defined as follows:
- All transactions involving two or more individual buyers listed on the deed were classified as family acquisitions. In most cases, these involved spouses, though other relationships and combinations also appear.
- All transactions made under any of the following categories — LLC, Ltd, Corp, Inc, Trust, Bank, Condominium Board — were classified as LLCs or LLC owners, while sales involving trusts, REOs and condominium boards were classified as trust & REO sales.
- Purchases made by a single individual were classified as either female or male acquisitions based on the buyer’s first name.
- The most frequent first names were calculated after standardizing variations. For example, “Mike,” and “Michael” were all counted under a single standardized name.
Related:
- 2025 Foreclosure Report: Manhattan Hits 15-Year Record as NYC Foreclosure Activity Accelerates
- NYC’s Top Residential Sales of 2025: From Record-Setting Penthouses to Historic Mansions
Like MediaFeed’s content? Be sure to follow us.
This article originally appeared on Propertyshark.com and was syndicated by MediaFeed.org


