Better to buy or rent? The price-to-rent ratio helps to gauge affordability in any city, especially for people on the move, and millions of Americans are, thanks in part to a remote-work boom.
The number can be helpful when looking at a certain area and deciding whether to plunk down your life savings into a home—if it’s even within reach—or pay a landlord and wait.
Read on to see the home price-to-rent ratio in 50 of the biggest U.S. cities.
Related: Should you buy or rent a home? Take the quiz
Image Credit: DepositPhotos.com.
First, what is the price-to-rent ratio?

The price-to-rent ratio compares the median home price and median annual rent in a given area. (You’ll remember that the median is the midpoint, where half the numbers are lower and half are higher.)
Median home sale price divided by median annual rent equals the ratio.
Let’s say the median rent in a city is $3,000 a month and the median sale price is $1,000,000. The price-to-rent ratio would be nearly 28—$1,000,000 divided by $36,000.
To make sense of that number:
- A ratio of 1 to 15 typically indicates that it is more favorable to buy than rent in a given community.
- A ratio of 16 to 20 indicates it is typically better to rent than buy.
- A ratio of 21 or more indicates it is much better to rent than buy.
The ratios could be useful when considering whether to rent or buy. And investors often look at the ratios before purchasing a rental property.
The number also may be used as an indicator of an impending housing bubble, as a substantial increase in the ratio could mean that renting is becoming a much more attractive option in that specific housing market.
If you’re exploring different areas, it might be a good idea to estimate mortgage payments based on median home prices.
Image Credit: Depositphotos.
A snapshot of real-life ratios

Here are 50 (plus one) popular metropolitan areas and their price-to-rent ratios as 2021 began, when the U.S. median home sale price was $346,800, the Federal Reserve Bank of St. Louis reported.
Median sale price listed comes from Redfin as of December 2020. Median rents listed come from a Zumper national rent report from February 2021, based on a one-bedroom apartment.
Remember, as home prices and rents shift over time, so do the ratios.
Image Credit: Feverpitched/ istockphoto .
52. Detroit

Detroit saw a spike in home sale prices, though the latest median was a relatively low $71,000, compared with median rent of $10,800, for a ratio of 6.5.
Image Credit: istockphoto/f11photo.
51. Milwaukee

Milwaukee is more favorable to homebuyers than renters, thanks to a price-to-rent ratio of 11. This Midwest city had a recent median sale price of $155,000 and rent of $14,400.
Image Credit: istockphoto.
50. Newark, New Jersey

Newark, anyone? The median sale price here was $271,000, but median rent spiked to $1,750 a month, leading to a buyer-friendly ratio of 13.
Image Credit: ChrisBoswell / istockphoto.
49. Baltimore

Charm City had a recent median home sale price of $198,000 and median rent of $14,160, for a price-to-rent ratio of 14.
Image Credit: DepositPhotos.com.
48. Philadelphia

This major East Coast city had a recent median sale price of $240,000 and median annual rent of $16,200, for a price-to-rent ratio of 15, the number that begins to signal that a place may be more favorable for buying over renting.
Image Credit: Deposit Photos.
47. Indianapolis

The ratio in this capital city is 16, thanks to a median home sale price of $185,000 and rent of $11,280.
Image Credit: f11photo / istockphoto.
46. Memphis, Tennessee

Memphis logs a ratio of 16, with a median home sale price of $163,000 and median annual rent of $9,960.
Image Credit: DepositPhotos.com.
45. Chicago

Chi-Town’s 16.5 ratio is based on a $305,000 median home sale price and $18,480 median rent.
Image Credit: James Andrews / istockphoto.
44. Kansas City, Missouri

In this Show-Me State city, a median home value of $218,000 and median annual rent of $12,000 equate to a price-to-rent ratio of 18.
Image Credit: tomofbluesprings/ istockphoto.
43. New Orleans
Next up is another charming Southern city, with a price-to-rent ratio of 18, given a median sale price of $312,500 and median rent of $17,040.
Image Credit: sfe-co2 / istockphoto.
42. Minneapolis

The Mini-Apple is sweeter on renting, with a ratio of 19, based on a median sale price of $295,000 and rent of $15,600.
Image Credit: DepositPhotos.com.
41. Miami
Those looking to put down roots in this vibrant city will find a price-to-rent ratio of a hair under 19, based on $360,000 and $19,200.
Image Credit: felixmizioznikov / istockphoto.
40. Atlanta

Heading South, Atlanta had a median sale price of $349,450 and median annual rent of $18,480, for a price-to-rent ratio of 19.
Image Credit: Nikola Spasic Photography / istockphoto.
39. Columbus, Ohio

The only Ohio city on this list had a price-to-rent ratio of 20, due to a median sale price of $208,000 and median annual rent of $10,320.
Image Credit: DepositPhotos.com.
38. Louisville, Kentucky

Despite having a different median sale price ($205,000) and rent ($10,440), Louisville had the same price-to-rent ratio as some bigger cities, at about 20.
Image Credit: istockphoto/Sean Pavone.
37. Houston

Houston, we have a number. It’s 20. That’s based on a median sale price of $269,000 and median annual rent of $13,200.
Image Credit: f11photo/istockphoto.
36. Fort Worth, Texas

Panther City’s price-to-rent ratio has crept up to 20, based on a home sale price of $262,000 and rent of $12,960.
Image Credit: Barbara Smyers / istockphoto.
35. Charlotte, North Carolina

Charlotte’s price-to-rent ratio of 20 arises from a median home sale price of $295,000 and median annual rent of $14,640.
Image Credit: Kruck20 / istockphoto.
34. Jacksonville, Florida

This east coast Florida city had a recent ratio of 20, based on a median sale price of $233,000 and rent of $11,640.
Image Credit: istockphoto/Sean Pavone.
33. Tampa, Florida

This major Sunshine State city had a price-to-rent ratio of 20, based on figures of $290,000 and $14,400
Image Credit: miroslav_1 / istockphoto.
32. Virginia Beach, Virginia
The ratio here has reached 21, based on a median home sale price of $290,000 and rent of $13,560.
Image Credit: TK Fotoshop / istockphoto.
31. Nashville

The first Tennessee city on this list is the Music City, with a ratio of 21.
Image Credit: istockphoto.
30. Omaha, Nebraska

With a median sale price of $206,750 and median annual rent of $9,600, Omaha had a recent home price-to-rent ratio of 21.5.
Image Credit: Matt Bills / iStock.
29. El Paso, Texas

El Paso traded a low price-to-rent ratio for a higher one when home prices rose. It’s at a 22, based on recent figures of $187,000 and $8,520.
Image Credit: pabradyphoto.
28. San Antonio, Texas

This Texas city southwest of Austin had a median sale price of $244,000 and median annual rent of $11,280, resulting in a price-to-rent ratio near 22.
Image Credit: DepositPhotos.
27. Arlington, Texas
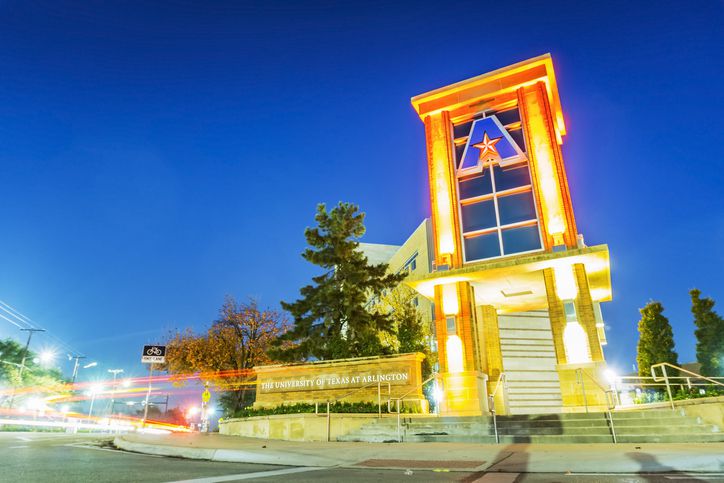
Back to the Lone Star State, this city between Fort Worth and Dallas, with median figures of $250,000 and $11,400, had a ratio of 22.
Image Credit: aphotostory / istockphoto.
26. Oklahoma City, Oklahoma

The capital of Oklahoma had one of the lower price-to-rent ratios until recent home price spikes. It logs a ratio of 23 lately, based on figures of $215,000 and $9,240.
Image Credit: Deposit Photos.
25. Fresno, California

Fresno makes the list with a price-to-rent ratio of nearly 23, based on figures of $300,000 and $13,200.
Image Credit: StellaMc / istockphoto.
24. Sacramento, California

This Northern California city had a recent median sale price of $402,000 and rent of $16,800, for a price-to-rent ratio of 24.
Image Credit: Deposit Photos.
23. Dallas

This sprawling city had a recent median sale price of $374,000 and median annual rent of $14,640, leading to a price-to-rent ratio of 25.5.
Image Credit: typhoonski.
22. Tulsa, Oklahoma

Tulsa had a price-to-rent ratio of 25, with low median rent of $7,680 but home sale prices ticking up to a median of $192,000.
Image Credit: Johnny Warrior / istockphoto.
21. Raleigh, North Carolina

The North Carolina capital, the City of Oaks, logs a ratio of 25, based on a $320,000 median home sale price and median rent of $12,600.
Image Credit: istockphoto/Mark Howard.
20. Phoenix

Phoenix’s price-to-rent ratio has revved up to 26, with a median home sale price of $320,000 and $12,120 in rent.
Image Credit: Sean Pavone / istockphoto.
19. Las Vegas

Sin City has reached a ratio of 26, based on a $314,900 median sale price vs. $12,000 in rent.
Image Credit: DepositPhotos.com.
18. Mesa, Arizona

With a median sale price of $325,000 and median rent of $12,240, Mesa slithers to a price-to-rent ratio of nearly 27.
Image Credit: FiledIMAGE/istock.
17. Washington, D.C.

The nation’s capital is another pushpin on the map with a high cost of living. The median sale price of $640,650 compares with median rent of $23,520 annually ($1,960 a month), translating to a ratio of 27.
Image Credit: DepositPhotos.com.
16. Albuquerque, New Mexico

In the Southwest, Albuquerque heated up to a ratio of 28, based on a median home sale price of $250,000 and rent of $8,880
Image Credit: nameinfame / istockphoto.
15. Colorado Springs, Colorado

With a median sale price of $366,000 and annual rent of $13,080, this city at the eastern foot of the Rocky Mountains had a recent price-to-rent ratio of 28.
Image Credit: Jacob Boomsma / istockphoto.
14. Denver

The Mile High City logged a renter-leaning ratio of 28, thanks to a median sale price of $476,000 and median annual rent cost of $16,800.
Image Credit: DepositPhotos.com.
13. Tucson, Arizona

In Tucson, the median sale price of $251,000 and median annual rent of $8,760 rounded up to a ratio of 29.
Image Credit: Sean Pavone / iStock.
12. Portland, Oregon

The midpoint of buying here of late was $485,000, compared with median rent of $16,800, for a price-to-rent ratio of 29.
Image Credit: DepositPhotos.com.
11. Boston
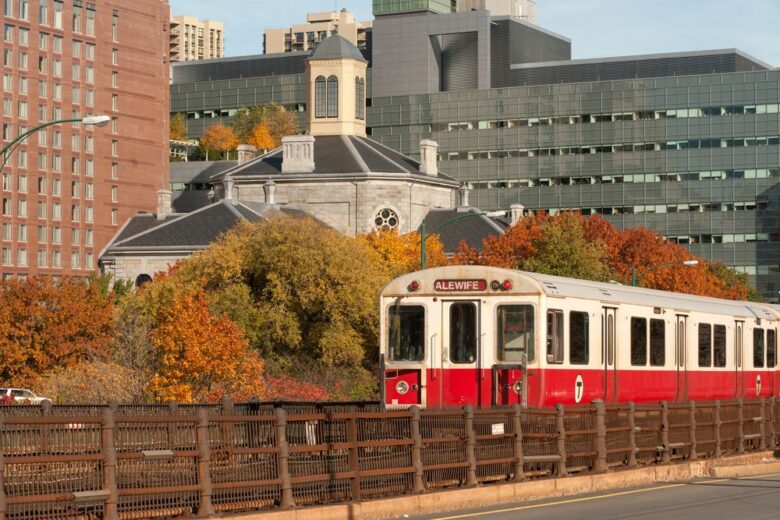
With a median sale price of $702,000 and median rent of $24,240 a year, Beantown had a price-to-rent ratio of 29.
Image Credit: DepositPhotos.com.
10. New York City

The median sale price here was $725,000 and median rent was $28,200 a year ($2,350 a month), which equates to a price-to-rent ratio of nearly 26.
Of course the city is composed of five boroughs, the Bronx, Brooklyn, Manhattan, Queens, and Staten Island, and it’s probable that most of the sales under $725,000 were not in Manhattan (where the median was $1.18 million) or Brooklyn (where the median was $915,000).
Just looking at Manhattan, even with rents falling to under $3,000 a month, the ratio looks more like 34 or 35.
Image Credit: thegoodphoto.
9. San Diego, California

Hop back to Southern California beaches and “America’s Finest City,” where a median sale price of $690,000 and median rent of $21,600 led to a ratio of 32.
Image Credit: istockphoto / Jerry Uomala.
8. Austin, Texas

A hotbed for artists, musicians, and techies, Austin had a price-to-rent ratio of 33, thanks to a median sale price of $475,000 and median annual rent of $14,400.
Image Credit: RoschetzkyIstockPhoto / istockphoto.
7. Oakland, California

Oakland, across the bay from San Francisco, had a median sale price of $785,000 and median rent of $24,000 a year ($2,000 a month), earning a price-to-rent ratio of close to 33.
Image Credit: Davel5957.
6. Honolulu

The ratio in the capital of Hawaii is a steamy 35, with a $620,000 median sale price and median rent of $17,520.
Image Credit: DepositPhotos.com.
5. Long Beach, California

With a median home price of $675,000 and rent of $1,600 a month, Long Beach earned a ratio of 35.
Santa Ana and Anaheim, just north of Santa Ana, were in the same league, with ratios of 33 and 34.
Image Credit: MattGush / istockphoto.
4. Los Angeles

A median sale price of $831,000 and median one-bedroom rent of $23,280 a year ($1,940 a month) shines a Hollywood light on renting, with a ratio of 36.
Image Credit: istockphoto/choness.
3. Seattle

The Emerald City had a median sale price of $725,000 and median annual rent of $20,388, for a price-to-rent ratio of close to 39.
Image Credit: DepositPhotos.com.
2. San Jose, California
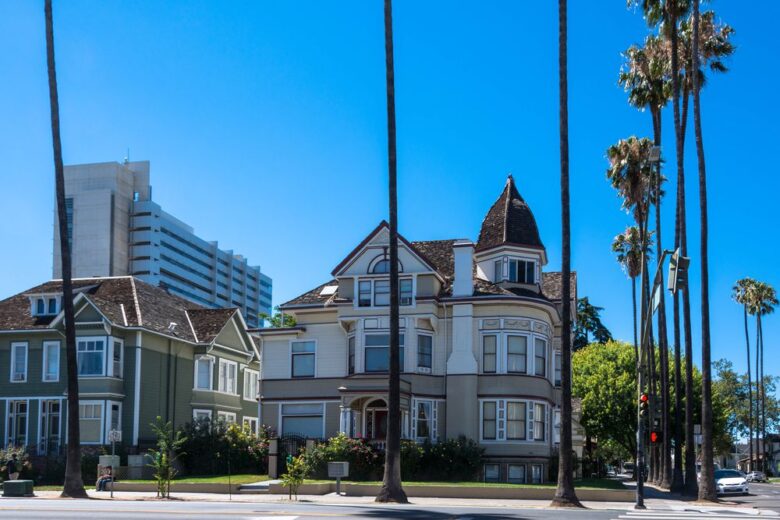
Golden State housing continues its pricey rep. The median sale price in San Jose was $1,050,000, and the city had median rent of $25,560 yearly ($2,130 a month), leading to a price-to-rent ratio of 41.
Image Credit: DepositPhotos.com.
1. San Francisco

It’s no secret that San Francisco housing prices are way up there. The median sale price was $1,350,000, and median rent was $2,680 per month (or $32,160 a year). That gives the hilly city a price-to-rent ratio of 42.
A snug studio at, say, $2,000 a month yields a ratio of 56.
Image Credit: DepositPhotos.com.
The takeaway
The price-to-rent ratio lends insight into whether a city is more favorable to buyers or renters. Usually in a range of 1 to 21-plus, the ratio is useful to house hunters, renters, and investors who want to get the lay of the land.
This article originally appeared on SoFi.com and was syndicated by MediaFeed.org.
Learn more:
SoFi Loan Products
SoFi loans are originated by SoFi Lending Corp. or an affiliate (dba SoFi), a lender licensed by the Department of Financial Protection and Innovation under the California Financing Law, license # 6054612; NMLS # 1121636 Opens A New Window.
SoFi Home Loans
Terms, conditions, and state restrictions apply. SoFi Home Loans are not available in all states.
Third Party Brand Mentions: No brands or products mentioned are affiliated with SoFi, nor do they endorse or sponsor this article. Third party trademarks referenced herein are property of their respective owners.
Financial Tips & Strategies: The tips provided on this website are of a general nature and do not take into account your specific objectives, financial situation, and needs. You should always consider their appropriateness given your own circumstances.
Image Credit: ablokhin / istockphoto.
More from MediaFeed: Do you make a middle-class income?

Do you make a middle-class income for your state?
Image Credit: jentakespictures / istockphoto.