
U.S. home foreclosure data shows a sharp increase in repossessions, with lenders taking back 5,794 properties in August 2026, a 42% increase from a year earlier.
Rising foreclosure activity comes as homeowners continue to face elevated borrowing costs, insurance expenses, and other household bills.
U.S. home foreclosure activity is rising, with new data revealing a significant year-over-year increase in properties repossessed by lenders.
According to real estate data firm ATTOM, lenders repossessed 5,794 properties through completed foreclosures in August 2026.
That represents a 42% increase from August 2025 and a 22% increase from July 2026.
The findings, reported by Black Enterprise on October 9, point to growing financial pressure among some American homeowners.
However, foreclosure activity remains below pre-pandemic levels, and the latest figures do not establish that the country is experiencing a housing crisis on the scale of the Great Recession.
The data provides a closer look at where home foreclosure activity is increasing, which states are recording the most repossessions, and what the latest numbers reveal about the U.S. housing market.
US Home Foreclosure Data Shows Repossessions Jumped 42%
ATTOM’s August 2026 U.S. Foreclosure Market Report recorded 40,277 U.S. properties with at least one foreclosure filing during the month.
That figure includes default notices, scheduled foreclosure auctions, and bank repossessions.
It was up 13% from August 2025 and 1% from July 2026.
The report also recorded 5,794 completed foreclosures, commonly referred to as real estate owned, or REO, properties.
These are properties that lenders have taken back through the foreclosure process.
The distinction matters because a foreclosure filing does not necessarily mean a homeowner has lost their property.
A filing may mark an earlier stage of the process, and some homeowners may resolve their delinquency before a foreclosure is completed.
Here are the key figures from ATTOM’s August report:
- 40,277 properties had foreclosure filings, up 13% year over year.
- 25,894 properties entered the foreclosure process, up 7% year over year.
- 5,794 properties were repossessed through completed foreclosures, up 42% year over year.
- 22% monthly increase in completed foreclosures compared with July 2026.
The data indicates that more properties are progressing through the foreclosure process and reaching the repossession stage than a year earlier.
However, the figures measure different stages of foreclosure activity and should not be added together as though they represent separate properties.
Which States Have the Most Home Foreclosures?
Texas recorded the highest number of completed foreclosures in August 2026, followed by California, North Carolina, Arizona, and Alabama.
The figures reported by ATTOM show where lenders repossessed the most properties during the month.
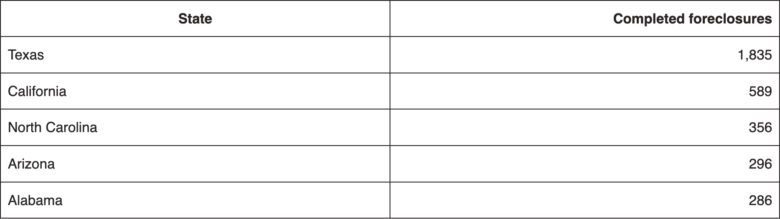
Texas recorded more than three times as many completed foreclosures as California, the state with the second-highest total in August.
However, raw totals do not tell the whole story.
States differ in population, housing stock, mortgage-market conditions, and the number of properties exposed to foreclosure.
Foreclosure rates, which compare filings with the number of housing units, provide another way to assess the relative concentration of activity.
South Carolina had the highest state foreclosure rate in August, with one in every 1,547 housing units receiving a foreclosure filing.
Nevada followed at one in 1,920, while Florida ranked third at one in 2,397.
Nationwide, one in every 3,569 housing units received a foreclosure filing.
These figures show why a state with the most completed foreclosures is not necessarily the state with the highest foreclosure rate.
Houston and Dallas Lead Major Metro Areas in Repossessions
Texas also recorded the highest number of completed foreclosures among major metropolitan areas.
Houston led with 448 completed foreclosures in August 2026, followed by Dallas with 402 and San Antonio with 256.

These numbers highlight the concentration of repossessions in major Texas metropolitan areas.
Still, the totals alone do not establish why foreclosures occurred in these locations or whether local homeowners are experiencing a uniform deterioration in their financial circumstances.
Understanding local foreclosure risk requires additional information, including housing prices, mortgage delinquencies, household income, employment trends, and the number of housing units in each market.
Florida, Texas, and California Record the Most Foreclosure Starts
Foreclosure starts measure properties entering the foreclosure process, making them an important indicator of activity before a lender completes a repossession.
ATTOM reported 25,894 foreclosure starts nationwide in August 2026, a 7% increase from August 2025. The total was down 3% from July.
Florida recorded the highest number of foreclosure starts, followed by Texas and California.

These figures do not mean every property entering foreclosure will ultimately be repossessed. Some borrowers may bring their mortgage payments current, negotiate with their lenders, sell their properties, or pursue other available options.
Nevertheless, an increase in foreclosure starts alongside a rise in completed foreclosures suggests that the pressure is not limited to a single stage of the process.
The next reports will help determine whether this annual increase persists.
Why Is Home Foreclosure Activity Increasing?
Higher household expenses and borrowing costs are among the pressures facing homeowners, according to ATTOM CEO Rob Barber, as cited by Black Enterprise.
Mortgage payments, property taxes, insurance premiums, utilities, and routine household expenses can place pressure on a household’s budget.
When borrowers fall behind on mortgage payments, lenders may begin foreclosure proceedings if the delinquency is not resolved.
However, the August foreclosure report does not establish that any single expense caused the increase in repossessions.
Several factors can influence foreclosure activity, including:
- Borrowing costs: High mortgage payments, housing costs, and other debt obligations can affect household affordability, particularly when borrowers have limited financial flexibility.
- Insurance and housing expenses: Higher insurance premiums and other property-related costs can leave homeowners with less money available for mortgage payments.
- Everyday expenses: Higher costs for necessities can strain household budgets, especially when income does not keep pace.
- Local economic conditions: Employment, income, housing-market conditions, and borrower circumstances can differ significantly across states and metropolitan areas.
The latest data supports the conclusion that foreclosure activity has increased year over year.
Establishing the precise contribution of each factor would require additional research into mortgage delinquencies, borrower finances, and local economic conditions.
Home Foreclosure Activity Is Rising, but the Market Is Not at Great Recession Levels
The increase in repossessions is significant, but historical context is essential.
ATTOM has emphasized that foreclosure activity remains below pre-pandemic levels, even as year-over-year increases have become more common.
The distinction is important because the United States experienced widespread housing distress during the Great Recession, when falling home values, mortgage defaults, and foreclosures affected households and financial institutions across the country.
The August 2026 data does not establish a return to those conditions.
Instead, the latest report shows that foreclosure activity is rising from comparatively contained levels, with some states and metropolitan areas recording substantially more activity than others.
An annual increase of 42% in completed foreclosures is notable, but the percentage change alone does not reveal the long-term severity of the problem.
The number of properties involved, the foreclosure rate, and comparisons with previous years are all necessary to assess the broader housing market.
First-Half 2026 Data Also Shows a Broader Increase
The August report follows a broader rise in foreclosure activity during the first half of 2026.
ATTOM reported that 227,548 U.S. properties had foreclosure filings during the first six months of 2026, a 21% increase from the same period in 2025 and a 28% increase from the first half of 2024.
During that period, completed foreclosures increased 33% year over year, while foreclosure starts rose 18%.
The first-half figures indicate that the August increase was part of a wider annual trend rather than an isolated monthly change.
However, annual increases do not automatically mean foreclosure activity will continue rising at the same pace.
Future reports will be needed to establish whether the trend accelerates, stabilizes, or reverses.
What the Latest Home Foreclosure Data Means for Homeowners
For homeowners, the latest numbers highlight the importance of distinguishing between early foreclosure proceedings and completed repossessions.
Receiving a foreclosure filing does not necessarily mean a home will be lost.
The outcome depends on the circumstances of the borrower, the stage of the proceedings, applicable state laws, and whether the delinquency can be resolved.
Homeowners who are struggling to make mortgage payments can contact their mortgage servicer to ask about available loss-mitigation options.
The Consumer Financial Protection Bureau also provides guidance on mortgage trouble and foreclosure prevention.
Borrowers can review the CFPB’s resources here: Consumer Financial Protection Bureau — Help for Homeowners.
For people tracking the housing market, the most useful indicators to monitor are foreclosure starts, completed foreclosures, mortgage delinquency rates, and foreclosure rates relative to local housing stock.
Taken together, these measures provide a clearer picture of whether financial pressure is becoming more widespread.
The Bottom Line
U.S. home foreclosure data shows a significant increase in repossessions, with lenders taking back 5,794 properties in August 2026, up 42% from a year earlier.
Total properties with foreclosure filings also increased 13% year over year to 40,277, while foreclosure starts rose 7% to 25,894.
Texas recorded the most completed foreclosures, and South Carolina had the highest state foreclosure rate.
Houston, Dallas, and San Antonio led major metropolitan areas in completed repossessions.
The figures point to increased financial strain among some American homeowners. However, ATTOM’s data also indicates that foreclosure activity remains below pre-pandemic levels.
The latest numbers therefore show a meaningful increase in home foreclosure activity without establishing that the United States is entering another housing crisis on the scale of the Great Recession.
Related:
- Retirees May See Massive Social Security Cuts Thanks to Immigration
- The Housing Market Is Now Shifting Towards Buyers
Like MediaFeed’s content? Be sure to follow us.
This article originally appeared on FrankNez.com and was syndicated by MediaFeed.co