
+51,600 jobs | 0.40%
In the US in July, small businesses with one to nine employees created 51,600 jobs — an increase of 0.40% since June. Nationally, these businesses now employ 13,064,300 people, up from 13,012,700 in the previous month*. Note that 13,012,700 is higher than the figure reported last month because the U.S. Bureau of Labor Statistics recently released new employment figures, and the Intuit QuickBooks Small Business Index always incorporates the latest official data as soon as it is available.
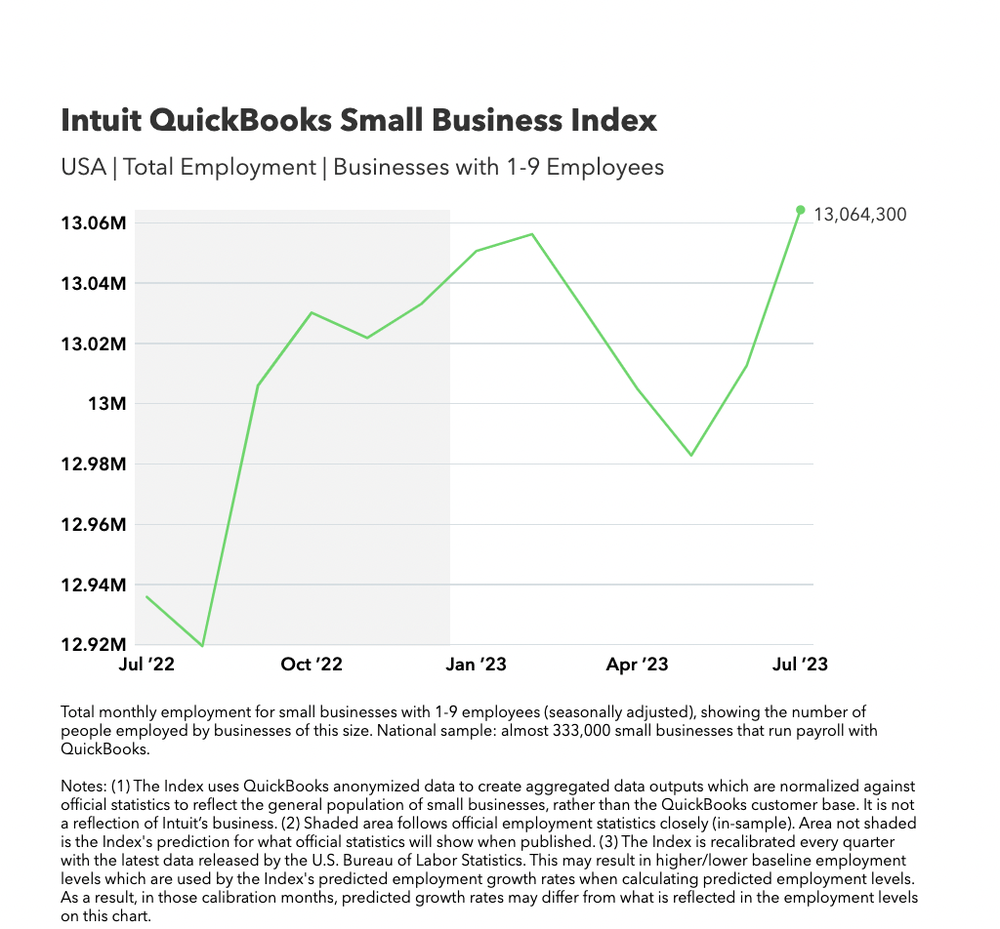
This is the second consecutive month small business employment has increased in the US. It is the largest monthly increase since the Intuit QuickBooks Small Business Index was launched in March 2023.

Small business employment grew in eight sectors in July
In July, small business employment grew in 8 of the 12 sectors that are covered by the Index. The top three sectors creating the most jobs are:
- Education and health services (NAICS 61 & 62): creating 12,000 jobs, with a monthly growth rate of 0.51%. Education includes business training, sports coaching, and language schools, as well as colleges and universities. Health services cover both physical and mental health care.
- Professional and business services (NAICS 54, 55–56): creating 6,400 jobs, with a monthly growth rate of 0.29%. This sector includes the legal and accounting professions, technical services such as engineering, architecture and design, and business services such as recruitment and administrative support.
- Construction (NAICS 23): creating 4,200 jobs, with a monthly growth rate of 0.56%. This sector includes both residential and commercial construction. For context, roughly one in seven small business jobs in the US are in construction, making it the third largest sector for small business employment — behind the educational and health services sector and the professional and business services sector.
The fastest growing sector in July was agriculture, natural resources, and mining (NAICS 11 & 21), with a monthly growth rate of 0.98% — creating 1,800 jobs. Agriculture includes farming, forestry, fishing, and hunting. Natural resources and mining cover oil and gas extraction, raw materials, and associated support services.
Manufacturing sector has fastest falling small business employment
Overall, small business employment fell in four sectors in July. The leisure and hospitality sector, the utilities, transport, and warehousing sector, and the information sector all dropped again this month (as they did in June) but the manufacturing sector now leads the sectors with fastest falling small business employment (outpacing the information sector last month).
- Manufacturing (NAICS 31-33): down by 0.22% with 2,700 fewer jobs across the US compared to June. The manufacturing sector includes all businesses that create products from raw materials, whether by hand, machinery, or chemical processes.
- Leisure and hospitality (NAICS 71 & 72): down by 0.13% with 1,900 fewer jobs. Leisure includes museums and attractions, theaters, casinos, golf courses, gyms, and spectator sports. Hospitality includes hotels, bars, coffee shops, and restaurants.
- Utilities, transport, and warehousing (NAICS 22 & 48–49): down by 0.08% with 600 fewer jobs. Utilities include power generation and distribution as well as sewage, irrigation, and air conditioning. Transport and warehousing covers all aspects of private and commercial transport for people and goods — including trucking, taxis, air, rail, and storage.

Small business employment grows in all eight US regions
The Great Lakes region created the most jobs in July — 14,800 in total — with a monthly growth rate of 0.78%. This is the second consecutive month that this region — which covers Illinois, Indiana, Michigan, Ohio, and Wisconsin — has created the most small business jobs in the US.
The Southeast region also had notable growth in July — adding 10,600 small business jobs — with a growth rate of 0.37%. This region includes Alabama, Arkansas, Florida, Georgia, Kentucky, Louisiana, Mississippi, North Carolina, South Carolina, Tennessee, Virginia, West Virginia.
Focusing on where small business employment is growing fastest, the Plains region (Iowa, Kansas, Minnesota, Missouri, Nebraska, North Dakota, and South Dakota) comes out on top, with a monthly growth rate of 0.93% and 8,300 new jobs created. This is up from 0.62% in June.
Ufuk Akcigit, the Arnold C. Harberger Professor of Economics at the University of Chicago, said: “Last month, the US witnessed a notable decline in inflation, as reported by the Bureau of Labor Statistics. The inflation rate dropped to 3%, marking a significant decrease from the 4% recorded in May and a substantial decrease compared to the 9.1% reported in June 2022. This decline in inflation is a positive signal for the economy, as it indicates a stabilization in price levels. This development may signal an alleviation of financial pressures for both consumers and businesses, fostering a more favorable economic environment. Chairman Jerome Powell indicated that the Federal Reserve no longer forecasts a recession. This optimistic outlook reflects a more positive stance from the central bank on the economy’s growth prospects.
“In addition to the good news on inflation, the performance of small businesses has been positive, according to the Intuit QuickBooks Small Business Index. The Bureau of Labor Statistics has reported overall growth in U.S. employment and, notably, small businesses have played a significant role in driving this, with a remarkable 0.40% increase in jobs. It’s also encouraging to see a second consecutive month of job growth, up from 0.18% last month, showcasing the resilience of small businesses in the current economic landscape.
“According to the Bureau of Labor Statistics’ latest Consumer Price Index data, energy prices showed a significant annual decline of 16.7% in July, reflecting improvements in energy market conditions. In parallel, the Intuit QuickBooks Small Business Index reported a 0.98% month-to-month increase in employment within the corresponding natural resources and mining sector — confirming a positive trend for this industry, and demonstrating how accurate the Index is at reflecting industry trends.
“On a different note, the sharpest price increase reported by the Bureau of Labor Statistics was in the ‘shelter’ category, which reflects current housing costs which are up 7.8%. From the Intuit QuickBooks Small Business Index, we see that one of the steepest declines in small business employment in July has been in the leisure and hospitality sector, with a decrease of 0.13%. Notably, this decline was second only to the manufacturing sector, which experienced a larger drop of 0.22%. These figures highlight the dynamic nature of the small business economy, where certain sectors thrive while others face headwinds. It underscores the importance of adaptability and resilience for small businesses to navigate the ever-changing market conditions successfully.
“The positive atmosphere in the overall economy was reflected in the fact that all eight US regions showed positive growth in July, according to the Index. The Plains and Great Lakes regions recorded the highest growth, with 0.93% and 0.78% respectively. The Great Lakes region had the largest net employment change this month with almost 15,000 new jobs created. These increases in small business employment reported in the Index are corroborated by a corresponding decrease in unemployment insurance claims in July. In particular, Michigan recorded 1,434 fewer weekly initial claims in the week ending July 8 compared to the previous week. Michigan reported to the U.S. Department of Labor that this was driven by fewer layoffs in the automobile, management of companies and enterprises industries.”
Get all the details from the interactive Small Business Index dashboard.
More information
Media inquiries
Media contact details for QuickBooks in the US can be found here on the Intuit website.
Canada Index
The Intuit QuickBooks Small Business Index is also published monthly in Canada.
UK Index
The Intuit QuickBooks Small Business Index is also published monthly in the UK, a few days after the US and Canada. Get the latest small business hiring insights for the UK on August 7.
About the Index
The Intuit QuickBooks Small Business Index is a timely new measure of small business employment and hiring in the US, Canada, and the UK. The Index launched in March 2023 and is updated monthly. The Index uses purpose-built economic models to normalize anonymized QuickBooks data to reflect the general population of small businesses in each country; it is not a reflection of Intuit’s business. The Index was developed in collaboration with leading economist Professor Ufuk Akcigit and an international team of researchers and academics.
Methodology
The Intuit QuickBooks Small Business Index creates aggregated data outputs from a sample of anonymized QuickBooks Online Payroll customer records which are calibrated using statistical methods to create modeled results which better reflect the general population of small businesses in each country, as represented by published official statistics. Statistical adjustment ensures the Index truly reflects employment and job vacancy changes rather than trends in the
Read more or download the full methodology here.
Rounded values
Total and monthly changes in employment and job vacancies have been rounded to the nearest hundred. Monthly changes and growth rates are calculated before total employment or job vacancy values are rounded. Rates have been rounded to the nearest hundredth.
Seasonal adjustments
The Index’s data insights are seasonally adjusted to limit the effect of seasonal patterns in employment and hiring throughout the year, which lead to regular fluctuations in workforce growth and contraction.
Employment growth formula
Employment growth(t) = [Employment(t)-Employment(t-1)]/[0.5*Employment(t)+0.5*Employment(t-1)]
*Employment levels
The Index produces a monthly prediction of employment growth rates by country, region, and sector. In order to translate these growth rates into the number of jobs/vacancies gained or lost, the growth rates are multiplied by the prior month’s predicted employment levels, except during the months when official statistics are published. During those months, the latest official employment levels that have been reported are used in the calculation instead of the Index’s prior month’s predicted employment levels. As a result, the Index’s predicted total employment levels may at times differ from the predicted growth rates. Official statistics are published at different frequencies depending on the country ranging from monthly to quarterly.
Time series
The Index uses data going back to January 2015 in the US and Canada and to January 2018 in the UK. Published at the earliest opportunity every month, the Index shows the number of people employed by small businesses (in the US and Canada) or the number of job vacancies at small businesses (in the UK) in the previous month and how that number has changed since the month before. The Index helps to eliminate almost all of the time lags in official statistics by providing estimated projections of what those statistics will ultimately show when they are published.
Sample sizes
The total sample across all three countries is around 424,000 small businesses. The US sample is almost 333,000 small businesses. The Canadian sample is almost 66,000 small businesses. The UK sample is almost 25,000 small businesses. The minimum sample sizes for regions or sectors to be included in the Index are 1,000 small businesses in the US, 800 small businesses in Canada, and 200 small businesses in the UK.
Target populations
In the US and UK, the Index targets the populations of small businesses with one to nine employees. In Canada, the target population is small businesses with one to 19 employees. The differences ensure the Index’s data insights are consistent with official statistics in each country, which are used for benchmarking during the calibration process. Timely data insights for these populations of small businesses are particularly valuable since most datasets fail to cover this portion of the economy well. Please note: Unlike in the US and Canada, the UK Index uses job vacancy data for calibration rather than employment data because official employment statistics are not currently available for small businesses on a monthly basis.
External data sources
External data sources used alongside the samples of anonymized QuickBooks Online Payroll customer data include:
- U.S. Bureau of Labor Statistics Business Employment Dynamics (BED) and Job Openings and Labor Turnover Survey (JOLTS)
- U.S. Bureau of Economic Analysis regions
Geographic regions
- USA data insights are divided into Bureau of Economic Analysis (BEA) regions
Industry sectors
- USA data insights are available by North American Industry Classification System (NAICS) sectors
This article originally appeared on the Quickbooks Resource Center and was syndicated by MediaFeed.org.
Small business grants for veterans

After serving in the military, many veterans turn to small business ownership. The appeal of creating something from scratch and doing what they love has attracted millions of vets to become entrepreneurs in the United States. But as you know, running a business typically has a hefty price tag attached to it.
Funding one can include small business loans for veterans as well as small business grants for veterans. There are pros and cons to both types of funding, and small business owners may rely on a combination of the two. We’ll cover information to help you better understand small business grants for veterans, including:
- What small business grants for veterans are
- Where to find small business grants for veterans
- How to get a small business grant for veterans
- General eligibility requirements
- Other funding options for veteran business owners
- Additional training and resources for veterans
Drazen Zigic / istockphoto

When it comes to finding money to help you launch or grow a business, you have a few options. One is a business loan, which needs to be paid back over time. You can also seek investors who, in exchange for giving you capital, will typically then own a piece of equity in your business. Your third option is a small business grant.
Unlike a loan, a grant doesn’t usually have to be paid back. It is essentially debt-free financing that allows you to have the capital you need to start or grow a business. Almost any business can apply for a grant, but there are some grants specifically geared toward veteran-run businesses. Given the amount of competition the average federal grant sees, you may have more of a fighting chance of getting one if the pool is limited to only veteran business owners.
Grants provide capital that can be used for many purposes in a business, from covering startup costs to allowing you to hire employees. You could use the funds to buy equipment or technology that helps you work more productively — it all depends on the grant itself.
Olivier Le Moal / Getty

There are many government small business grants available to veterans. It’s just a matter of knowing where to look in order to find the right one for you and your business. Whether you’re seeking small business startup grants for veterans or business grants for disabled veterans, here are some resources to get a start on your search.
DepositPhotos.com

Grants.gov is a large database of all the federal grants available to anyone, including vets. You can search by agency, category or eligibility. Each grant has different eligibility requirements, and only certain types of organizations may apply. It’s important to read those requirements carefully to make sure you qualify.

Another database to spend some time on is GrantWatch. Here, you can find grants from federal, state and local government agencies, as well as foundations and corporations in each state.
DepositPhotos.com

Most states have web portals with resources for veterans living in that state. For example, California’s CalVet lists resources for veterans and service-disabled vets, which may include self-employment grants for service-disabled veterans. You can also find local Veteran Business Outreach Centers (VBOCs) by zipcode here.
Motortion / istockphoto

There are small business grants for veterans in a variety of situations, from disabled vets to those starting a brand new business. Requirements will vary, but most require you to be a veteran, reserve or transitioning active duty member of any branch of the U.S. military. Some grants are also open to spouses or children of military members.
Zinkevych / istockphoto

To apply for a grant, first review the eligibility requirements to ensure you meet them. Pay attention as well to deadlines so you don’t waste time filling out paperwork for a grant that’s already closed its window for applications.
DepositPhotos.com

Gather the required paperwork, which might include a business plan, financial statements or mission statement. Next, allot plenty of time to write your grant proposal and/or fill out the application. You may be asked how your business started or what you plan to do with the funds. Answer honestly, but don’t be shy about singing your company’s praise. This is your opportunity to display what is unique about your business.
DepositPhotos.com

Finally, carefully review your application and make sure you included everything required. Proofread your proposal, maybe asking a colleague to provide a second set of eyes. You want your application to be as flawless and engaging as possible.
You may also consider hiring a grant writer. This is someone who fills out grant applications for a living. They will likely be more familiar with the process and what reviewers are looking for in an application.
Prostock-Studio/ istockphoto

Grants are often difficult to get, with so much competition for each of them. You may still have other financing options, many of which are also geared specifically for veterans.
istockphoto / yacobchuk

While you may qualify for any business loan, when applying for small business loans, look for those that offer preference to vets. StreetShares, for example, offers both small business loans and lines of credit at low rates for veterans.
The SBA provides a variety of small business loans for veterans, including the Military Reservist Economic Injury Disaster Loan program, which provides capital to eligible small businesses to cover expenses it couldn’t otherwise cover because an essential employee was “called up” to active duty in the military reserve. There is also the Veteran’s Advantage Guaranteed Loans program, which provides up to $150,000 fee-free loans to veteran-owned businesses.
When evaluating loan options, it’s important to look at interest rates and terms. This includes how long you will be paying back the loan and how much you will spend over the length of that loan.
DepositPhotos.com

Angel investments or venture capital can provide another option for financing. Hivers and Strivers is an angel investment group that funds early-stage startup companies founded and run by graduates of the U.S. Military Academies. In addition to investing capital, the organization also provides useful contacts, industry experience and mentorship.
Ridofranz // istockphoto

If you happen to be a female vet, you may have even more resources at your disposal. There are small business loans for women, as well as small business grants for women, that can help you find the capital you need to grow your business.
Some cater specifically to female vets, like StreetShares Foundation’s Female Founders Veteran Small Business Award. This award gives three women $25,000 in total and provides them with the opportunity to pitch their ideas to investors.
To qualify for StreetShares Foundation’s grant, you must be a veteran, reserve or transitioning active duty member of any of the United States Armed Forces, a spouse of a military member or the child or immediate family member of a military member who died on active duty.
You must be 21 and own at least 51% of the veteran-owned business. The grant is given to qualified applicants who lack financial means to start or grow an early-stage business or non-profit.
vadimguzhva / istockphoto

Beyond grants and loans, there are resources that can help you plan, launch, and grow your veteran-owned business.
The Small Business Administration’s Office of Veterans Business Development provides resources and small business programs as well as training, counseling, and mentorship, as well as information on Federal procurement programs for veterans.Who is eligible for these services?
- Veterans
- Service-disabled veterans
- Reserve component members
- Their dependents or survivors
Here are some other funding options to consider.
AndreyPopov/istock

The federal government has the aim to award at least 3% of all federal contracting dollars to service-disabled veteran businesses each year. The Service-Disabled Veteran-Owned Small Businesses program assists service-disabled veterans in securing those government contracts. Their eligibility criteria is as followings:
- Small business
- At least 51% owned and controlled by one or more service-disabled veterans
- Have one or more service-disabled veterans manage day-to-day operations and make long-term decisions
- Service-connected disability
EvgeniyShkolenko / istockphoto

The Warrior Rising program includes the Warrior Academy, designed to help “vetrepreneurs” at every stage of business growth succeed. It also provides vets with mentoring, assistance in finding funding options, and a community of veteran business owners who offer one another support. Warrior Rising’s process includes:
- Intake and tracking: Phone interview to understand your background and determine where you most need help
- Instruction: Warrior Academy: Self-paced video modules with homework and feedback
- Mentoring: One-on-one coaching in specific areas like marketing or accounting
- Funding opportunities: Assistance helping you find the best grants or loans
- Warrior Community: Connects you with other “vetrepreneurs” in your area
Peppersmint / istockphoto

Patriot Boot Camp provides educational small business programs, mentors, and a community of experts and peers to active duty service members, veterans and their spouses looking to start a business. Programs offered include:
- 3-day bootcamps
- Lunch and learn sessions
- Webinars
Johnrob

Veterans Business Resource Center provides counseling and mentoring services for new veteran business owners, as well as training and webinars to continue their education. Services offered include:
- Marketing plan assistance
- Training and events
- Financial analysis
- Business strategy
- Consulting
- Government contracting assistance
DepositPhotos.com

Another entrepreneurship program, V-WISE IGNITE, targets women veterans looking to start a business. The one-day training event provides resources and support to help them on their path.Who is eligible for these services?
- National Guard and Reserve components
- Active duty women service members of any military branch, including National Guard and Reserve components
- Women spouses/same-sex life partners of above (including widowed spouses/partners)
DepositPhotos.com

The U.S. Department of Veterans Affairs has a program, Veteran Readiness and Employment (VR&E) Self-Employment Track, that provides assistance to veterans with service-connected disabilities or employment barriers. The program assists in creating a business plan, analyzing your business concept, and providing you with the resources you need to succeed. Who is eligible for these services?
- Service member or veteran with an employment barrier or handicap
- Service-connected disability makes it hard for you to prepare for, obtain and maintain suitable employment
qingwa / istockphoto

Boots to Business (B2B) is a program created by the SBA and Office of Veterans Business Development, and it provides courses to help vets become successful business owners.Who is eligible for these services?
- Transitioning service members (including National Guard and Reserve)
- Their spouses on military installations worldwide
Depositphotos

The Entrepreneurship Bootcamp for Veterans (EBV) program is offered free of charge to post-9/11 veterans and their families. It targets businesses in early-growth mode, providing entrepreneurship and business management training. Programs available include:
- EBV Accelerate: A bootcamp-style program that provides insight and education on financial, management, marketing, and strategic planning challenges established businesses encounter.
- EBV Program: cutting edge, experiential training in entrepreneurship and business management for companies in early growth mode.
- EBV-Families Program: Provides the same training to family of qualified veterans.
istockphoto/Ridofranz

If you are interested in bidding on government contracts, explore the Vets First Verification Program. Run through the Office of Small & Disadvantaged Business Utilization (OSDBU), this program gives vets priority when bidding on federal and state government contracts, as well as better access to capital and tax relief.Who is eligible for these services?
- Veteran owns 51% or more of the company
- Veteran has full control over the day-to-day management, decision-making, and strategic policy of the business
- Veteran has managerial experience
- Veteran is the highest-paid person in the company
- Veteran works in the business full time
- Veteran holds the highest officer position in the company
DepositPhotos.com

Small business grants for veterans provide a unique opportunity: access to capital free of charge that can help you realize your entrepreneurial dreams. Realize that the grant process may be slow, so it’s important to start your homework early to find the grants that you qualify for. In general, you can apply for and accept multiple grants.
You can also combine multiple financing options to launch or expand your business. This can mean a combination of grants and loans, and possibly investors as well. It’s a good idea to evaluate all funding sources to find what works best for you.
Learn more:
This article originally appeared on LanternCredit.comand was syndicated by MediaFeed.org.
Lantern by SoFi:
This Lantern website is owned by SoFi Lending Corp., a lender licensed by the Department of Financial Protection and Innovation under the California Financing Law, license number 6054612; NMLS number 1121636. (www.nmlsconsumeraccess.org)
All rates, fees, and terms are presented without guarantee and are subject to change pursuant to each provider’s discretion. There is no guarantee you will be approved or qualify for the advertised rates, fees, or terms presented. The actual terms you may receive depends on the things like benefits requested, your credit score, usage, history and other factors.
*Check your rate: To check the rates and terms you qualify for, Lantern conducts a soft credit pull that will not affect your credit score. However, if you choose a product and continue your application, the lender(s) you choose will request your full credit report from one or more consumer reporting agencies, which is considered a hard credit pull and may affect your credit.
All loan terms, including interest rate, and Annual Percentage Rate (APR), and monthly payments shown on this website are from lenders and are estimates based upon the limited information you provided and are for information purposes only. Estimated APR includes all applicable fees as required under the Truth in Lending Act. The actual loan terms you receive, including APR, will depend on the lender you select, their underwriting criteria, and your personal financial factors.
The loan terms and rates presented are provided by the lenders and not by SoFi Lending Corp. or Lantern. Please review each lender’s Terms and Conditions for additional details.
Personal Loan:
SoFi Lending Corp. (“SoFi”) operates this Personal Loan product in cooperation with Even Financial Corp. (“Even”). If you submit a loan inquiry, SoFi will deliver your information to Even, and Even will deliver to its network of lenders/partners to review to determine if you are eligible for pre-qualified or pre-approved offers.
The lenders/partners receiving your information will also obtain your credit information from a credit reporting agency. If you meet one or more lender’s and/or partner’s conditions for eligibility, pre-qualified and pre-approved offers from one or more lenders/partners will be presented to you here on the Lantern website. More information about Even, the process, and its lenders/partners is described on the loan inquiry form you will reach by visiting our Personal Loans page as well as our Student Loan Refinance page.
Student Loan Refinance:
SoFi Lending Corp. (“SoFi”) operates this Student Loan Refinance product in cooperation with Even Financial Corp. (“Even”). If you submit a loan inquiry, SoFi will deliver your information to Even, and Even will deliver to its network of lenders/partners to review to determine if you are eligible for pre-qualified or pre-approved offers. The lender’s receiving your information will also obtain your credit information from a credit reporting agency. If you meet one or more lender’s and/or partner’s conditions for eligibility, pre-qualified and pre-approved offers from one or more lenders/partners will be presented to you here on the Lantern website.
More information about Even, the process, and its lenders/partners is described on the loan inquiry form you will reach by visiting our Personal Loans page as well as our Student Loan Refinance page. Click to learn more about Even’s Licenses and Disclosures, Terms of Service, and Privacy Policy.
Student loan refinance loans offered through Lantern are private loans and do not have the debt forgiveness or repayment options that the federal loan program offers, or that may become available, including Income Based Repayment or Income Contingent Repayment or Pay as you Earn (PAYE).
Notice: Recent legislative changes have suspended all federal student loan payments and waived interest charges on federally held loans until 09/30/21. Please carefully consider these changes before refinancing federally held loans, as in doing so you will no longer qualify for these changes or other future benefits applicable to federally held loans.
Auto Loan Refinance:
Automobile refinancing loan information presented on this Lantern website is from MotoRefi. Auto loan refinance information presented on this Lantern site is indicative and subject to you fulfilling the lender’s requirements, including: you must meet the lender’s credit standards, the loan amount must be at least $10,000, and the vehicle is no more than 10 years old with odometer reading of no more than 125,000 miles. Loan rates and terms as presented on this Lantern site are subject to change when you reach the lender and may depend on your creditworthiness. Additional terms and conditions may apply and all terms may vary by your state of residence.
Secured Lending Disclosure:
Terms, conditions, state restrictions, and minimum loan amounts apply. Before you apply for a secured loan, we encourage you to carefully consider whether this loan type is the right choice for you. If you can’t make your payments on a secured personal loan, you could end up losing the assets you provided for collateral. Not all applicants will qualify for larger loan amounts or most favorable loan terms. Loan approval and actual loan terms depend on the ability to meet underwriting requirements (including, but not limited to, a responsible credit history, sufficient income after monthly expenses, and availability of collateral) that will vary by lender.
Life Insurance:
Information about insurance is provided on Lantern by SoFi Life Insurance Agency, LLC.
DepositPhotos.com
Featured Image Credit: svetikd/istockphoto.


