
10 places where home value estimates have shifted since summer
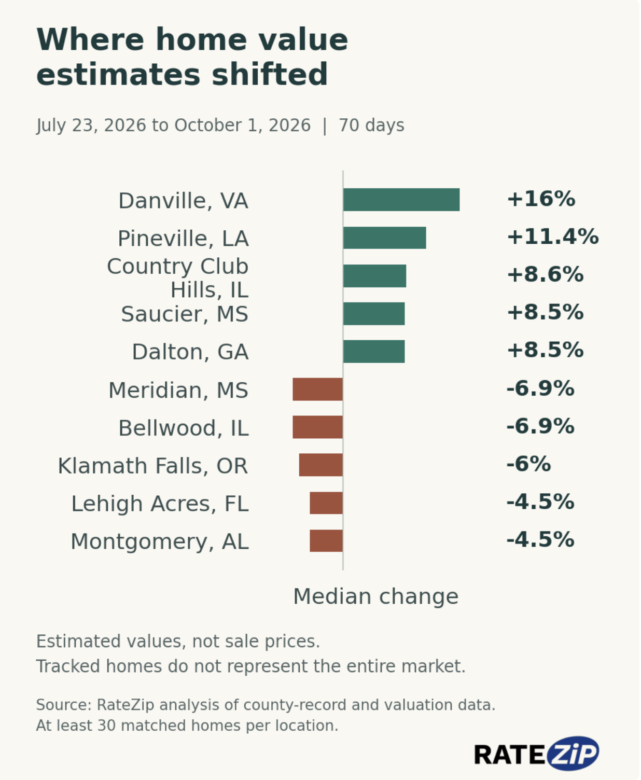
Danville, Virginia, tops RateZip’s latest list of places where home value estimates have risen since summer. The median increase among the homes analyzed there was 16% between July 23 and October 1.
At the other end of the list, Meridian, Mississippi, had the largest median decline, at 6.9% over the same period.
For homeowners thinking about selling or refinancing, those differences are a reminder to look close to home. A broad housing-market figure can tell a different story from the estimates for properties in your area.
RateZip compared estimated values for the same homes on both dates. These are estimates, rather than prices paid by buyers, and the homes in the analysis do not represent every property in each community.

Five places where estimates rose
Danville led the increases, followed by Pineville, Louisiana. The five largest gains among places included in the analysis were:
- Danville, Virginia: up 16%.
- Pineville, Louisiana: up 11.4%.
- Country Club Hills, Illinois: up 8.6%.
- Saucier, Mississippi: up 8.5%.
- Dalton, Georgia: up 8.5%.
Each percentage is the median change for the homes analyzed in that location: half had a larger change and half had a smaller change, allowing for ties. It does not mean every homeowner saw that increase.
A higher estimate can be encouraging if you’re preparing to sell. Before choosing an asking price, compare your home with similar properties that have recently sold, including their size and condition. A buyer will be considering those differences, too.
Related: Today’s mortgage rates
Five places where estimates fell
Meridian and Bellwood, Illinois, both had median declines that rounded to 6.9%, with Meridian slightly lower before rounding. The five largest declines were:
- Meridian, Mississippi: down 6.9%.
- Bellwood, Illinois: down 6.9%.
- Klamath Falls, Oregon: down 6%.
- Lehigh Acres, Florida: down 4.5%.
- Montgomery, Alabama: down 4.5%.
A lower estimate can be unsettling, especially if you bought recently. But it does not tell you what a buyer would offer today, or whether you owe more on your mortgage than the home is worth. That second question also depends on your outstanding loan balance.
The figures also cannot explain why a particular estimate changed. New property information, changes to the valuation model and market conditions can all affect an estimate.

What this means for your home
Across the homes in RateZip’s July-to-October comparison, about 47% had higher estimates, about 38% had lower estimates and about 15% were unchanged. The overall median change was zero, even though most individual estimates moved.
Your own home may follow a different path. A city ranking is a starting point for questions, not a price tag for your property.
If you plan to sell, ask a local real estate professional to walk you through recent comparable sales. If you’re considering refinancing, ask your lender how it will determine your home’s value. The Consumer Financial Protection Bureau explains that a lender may need a new appraisal or may use another way to assess the property.

Bought in the past few years?
In a separate comparison, 30% of the homes RateZip tracked that last sold in 2022 or later had an estimated value below their purchase price. Across that group, the median estimate was still 6% above the purchase price.
Those buyers purchased at different times, so the figures do not describe a change since July. They also do not mean 30% of homeowners have lost money or have negative equity. An estimated value, a completed sale price and the amount left on a mortgage answer different questions.
Before making a decision, put the estimate alongside recent nearby sales, your home’s condition and your own plans. That gives you more to work with than a single number on a screen.

How we put this list together
RateZip used county-record and valuation data to compare estimates collected on July 23 and October 1, 2026. The comparison covers 70 days, the longest available history for this edition; six months of historical estimates are not yet available. Each location needed at least 30 matched homes to qualify. Rankings use unrounded median percentage changes. The sample is not representative of the full housing market, and collection dates do not tell us when each estimate was recalculated.
The purchase-price comparison uses each home’s most recent available estimate collected from July 23 through October 1 and its last recorded arm’s-length purchase in 2022 or later. RateZip’s Home Value Movers data page has the separate monthly and purchase-price tables.
Ask us! What questions do you have about content, strategy, pop culture, lifestyle, wellness, history or more? We may use your question in an upcoming article!
Like MediaFeed’s content? Be sure to follow us.
This article originally appeared on Rate Zip and was syndicated by MediaFeed.co