
Same Same, but Different Different
This week’s big news story was, yet again, about inflation. January headline CPI came in above expectations but slightly below December. Meanwhile the month-over-month numbers were bang-on expectations. In my opinion, it was more or less a “non-event” since many were expecting a big surprise. Markets couldn’t make up their minds all day and the S&P saw six large intraday swings, moving from red to green and back again multiple times throughout the trading session.
But that’s not what I want to write about today, I want to write about the neverending new ways we find to measure inflation, and how pointless they may end up being at the end of all this. With each passing month and constant discussion over inflation, I find myself getting more and more frustrated by this topic.
Core no More
We’ve long had two main measures of inflation: headline and core. We’ve also had two different methods of measuring both: CPI and PCE. The Fed’s stated inflation target is 2%, and their preferred measurement has always been core PCE. Regardless of which one you use, inflation is still above target.
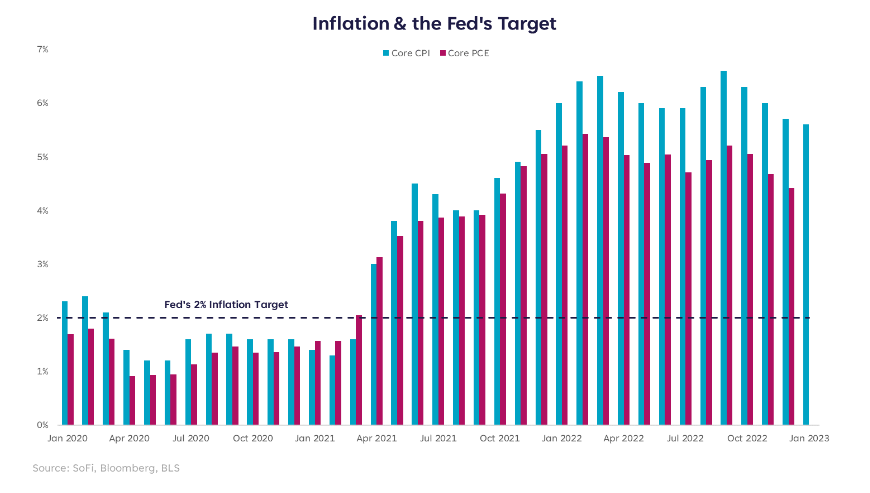
The theory behind core measures of inflation is that they remove the volatile components of food and energy, which are sensitive to outside events (e.g., weather, animal sickness, war, etc.). Although I understand the reason behind this, and agree the Fed should not change monetary policy in response to knowingly volatile numbers, the issue I’ve had with using it to declare victory or defeat is that consumers still have to buy food and energy everyday.
Moreover, this cycle has given birth to an even more nuanced measure of inflation, coined the “super core.” The measure strips out food, energy, goods, and shelter (a.k.a. core services ex-shelter). You might ask…what’s left? I’d respond, good question. Technically what’s left is services such as transportation, medical care, education, communication, recreation, water/sewer/trash collection and other household and personal services.
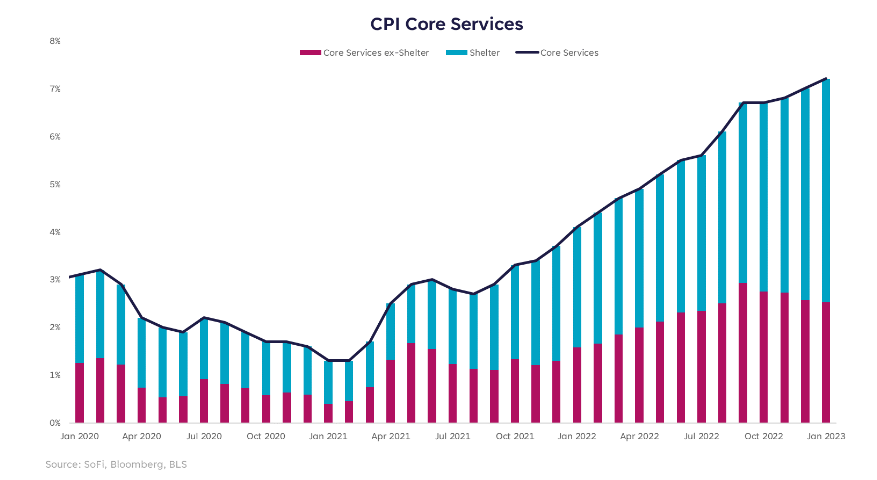
Again, I understand the theory here. Services inflation is sticky, less affected by supply chain issues that were transitory, and removing shelter costs strips out the delayed reaction that housing typically sees.
But the reality is that it strips out A LOT of the non-negotiable items we all pay for on a daily, weekly, or monthly basis. Not to mention, shelter is typically the largest expense for all consumers.
Good on Paper, Bad IRL
Highlighting the disconnects between what the market is watching and what happens on main street are not new, nor is my frustration with the concepts. But at this point in the data stream, things have gotten so murky and so over complicated that sometimes it’s important to over simplify in order to remember the bottom line.
The bottom line is that our economy doesn’t grow without the consumer. No matter which camp you’re in — soft landing, no landing, crash landing — US GDP is, and will continue to be, reliant on consumption in order to produce consistent growth.
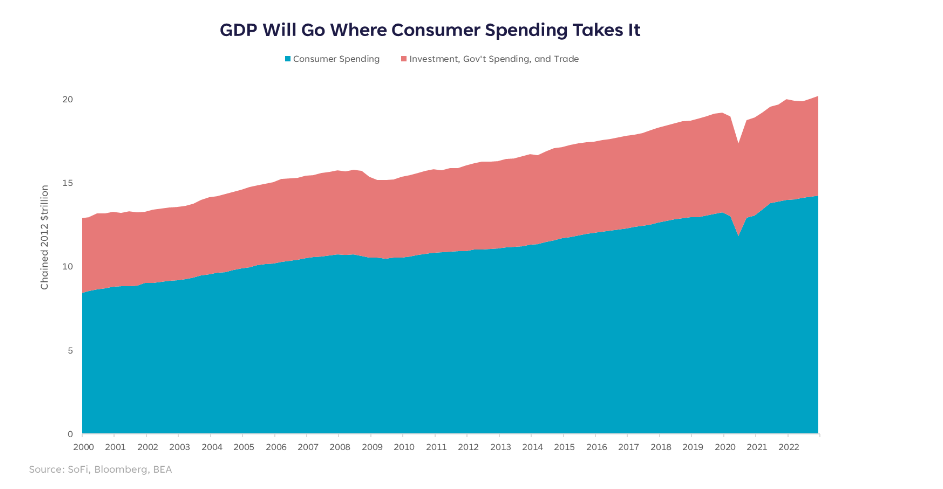
The good news is that food and energy prices have come down considerably since their peaks in 2022, giving the consumer some breathing room. But they’re still elevated compared to pre-pandemic. Shelter has not come down, and services inflation continues to rise.
If consumers end up spending more than before on necessary expenses such as shelter, food, and energy, they naturally have less to spend on other items. On one hand, a drop in demand will serve to bring inflation down further, but it also ignores the chance that consumers overspend and end up in debt. Debt that carries higher interest rates than it has in decades.
Since early 2020, it’s true the consumer has built up a cash buffer, and has benefitted from wage growth. That’s provided unprecedented spending power, and judging by a rebound in retail sales and consumer confidence indicators, people are still spending in a big way.
But the liquidity candy bowl is gone and isn’t coming back any time soon. If we want to go buy our own candy, it’s more expensive than before. My intuition and common sense says there’s not a bottomless pit of savings to support this level of spending, and there’s not a bottomless pit of wage growth to keep it elevated enough to drive GDP indefinitely. I often wonder if the market is simply ignoring this possibility, or if I’m underestimating the strength of the consumer. Time will tell, but I still believe something’s gotta give.
Learn More:
This article originally appeared on SoFi.com and was syndicated by MediaFeed.org.
Please understand that this information provided is general in nature and shouldn’t be construed as a recommendation or solicitation of any products offered by SoFi’s affiliates and subsidiaries. In addition, this information is by no means meant to provide investment or financial advice, nor is it intended to serve as the basis for any investment decision or recommendation to buy or sell any asset. Keep in mind that investing involves risk, and past performance of an asset never guarantees future results or returns. It’s important for investors to consider their specific financial needs, goals, and risk profile before making an investment decision.
The information and analysis provided through hyperlinks to third party websites, while believed to be accurate, cannot be guaranteed by SoFi. These links are provided for informational purposes and should not be viewed as an endorsement. No brands or products mentioned are affiliated with SoFi, nor do they endorse or sponsor this content.
Communication of SoFi Wealth LLC an SEC Registered Investment Advisor
SoFi isn’t recommending and is not affiliated with the brands or companies displayed. Brands displayed neither endorse or sponsor this article. Third party trademarks and service marks referenced are property of their respective owners.
Communication of SoFi Wealth LLC an SEC Registered Investment Adviser. Information about SoFi Wealth’s advisory operations, services, and fees is set forth in SoFi Wealth’s current Form ADV Part 2 (Brochure), a copy of which is available upon request and at www.adviserinfo.sec.gov. Liz Young is a Registered Representative of SoFi Securities and Investment Advisor Representative of SoFi Wealth. Her ADV 2B is available at www.sofi.com/legal/adv.
More from MediaFeed:
Foreclosure rates are through the roof in these states

Despite a stall in foreclosure activity these last few months, the overall trend seen over the past two years indicates a more negative pattern that may continue into the coming year.
According to the experts at ATTOM Data Solutions, 31,557 U.S. households filed for foreclosure in January, more than 2 percent higher from the previous month, but up 36 percent over last year. Accordingly, experts are speculating that a rise in foreclosure rates is to be expected in 2023 – at least in the early months.
The housing industry has been flipped on its head by high mortgage rates, which have caused a dramatic cooling of a once-hot market. As of February 16th, 2023, a typical 30-year fixed mortgage had an interest rate of 6.78 percent, up 0.03 percent from the previous week, and up 4.1 percent from the same time last year.
Despite many unfavorable theories concerning foreclosure trends, the future of the housing market remains optimistic. Most real estate analysts forecast lower consumer demand and cheaper home prices, and homebuyers are the most likely to benefit.
Read on for the foreclosure rates in January 2023 – plus the five counties or county equivalents with the highest rates within those states.
Related: The safest cities in the US
Photosbyjam / iStock

As previously noted, foreclosure rates increased slightly compared to last month, but are up significantly compared to last year. Read on for January foreclosure rates for all 50 states — plus the District of Columbia — beginning with the state that had the lowest rate of foreclosure filings per housing unit.
DepositPhotos.com

Ranking in population between Vermont and Alaska, the country’s second-and-third-least populous states, Washington, D.C. had 49 foreclosures in January, a substantial decrease compared to December’s 61. With a total of 344,306 housing units, the foreclosure rate of the Nation’s Capital was one in every 7,027 households, putting it in between the states of Virginia (#30) and Mississippi (#31).
DepositPhotos.com

Unsurprisingly, the Mount Rushmore State nabbed the 50th spot for its January foreclosure rate for the fifth month in a row. Having 388,373 total housing units, the fifth-least populous state had a foreclosure rate of one in every 55,482 households with 7 foreclosures. The counties with the most foreclosures per housing unit were (from highest to lowest): Turner, Codington, Brookings, Hughes, and Minnehaha.
RiverNorthPhotography

Listed as 44th in population, the Treasure State took the 49th spot. With 24 foreclosures out of 512,553 housing units, Montana’s foreclosure rate was one in every 21,356 homes. The counties with the most foreclosures per housing unit were (from highest to lowest): Deer Lodge, Roosevelt, Stillwater, Custer, and Silver Bow.
YinYang

In 49th place for population, the Green Mountain State ranked 48th for foreclosure rate this month. Of the state’s 333,519 housing units, 16 homes went into foreclosure at a rate of one in every 20,845 households. The counties with the most foreclosures per housing unit were (from highest to lowest): Essex, Grand Isle, Rutland, Windsor, and Bennington.
DenisTangneyJr

The Peace Garden State’s foreclosure rate was one in every 19,480 homes. This puts the fourth-least populous state — with 370,111 housing units and 19 foreclosures — in 47th place once again. The counties with the most foreclosures per housing unit were (from highest to lowest): Morton, Stutsman, Ward, Grand Forks, and Cass.
sequential5

The Sunflower State ranked 46th in January. With 1,272,290 homes and a total of 71 housing units going into foreclosure, the 35th most populous state’s foreclosure rate was one in every 17,920 households. The counties with the most foreclosures per housing unit were (from highest to lowest): Logan, Rush, Gray, Washington, and Morris.
fotoguy22 / iStock

Sorted as 13th in population, the Evergreen State ranked 45th for highest foreclosure rate. It has 3,170,695 housing units, of which 244 went into foreclosure, making the state’s foreclosure rate one in every 12,995 households. The counties with the most foreclosures per housing unit were (from highest to lowest): Mason, Pacific, Jefferson, Yakima, and Lewis.
4nadia

With a total of 1,988,420 housing units, the Bluegrass State saw 166 homes go into foreclosure, securing 44th place in January. This puts the foreclosure rate for the 26th most populous state at one in every 11,978 households. The counties with the most foreclosures per housing unit were (from highest to lowest): Hardin, Clinton, Trigg, Boyd, and Christian.
Thomas Kelley

Ranked 39th in population, the Mountain State earned the 43rd spot this month. It has 859,437 housing units, of which 80 went into foreclosure. This means that the foreclosure rate was one in every 10,743 homes. The counties with the most foreclosures per housing unit were (from highest to lowest): Tucker, Hancock, Doddridge, Kanawha, and Wyoming.
hkim39 // istockphoto

Ranked 38th in population, the Gem State earned the 42nd spot as 70 of its homes went into foreclosure in January. With 742,145 total housing units, the state’s foreclosure rate was one in every 10,602 households. The counties with the most foreclosures per housing unit were (from highest to lowest): Bear Lake, Shoshone, Franklin, Jefferson, and Elmore.
knowlesgallery

New Hampshire, the 41st most populous state, also ranked 41st for highest foreclosure rate. The Granite State saw 62 of its 636,480 homes go into foreclosure, making for a foreclosure rate of one in every 10,266 households. The counties with the most foreclosures per housing unit were (from highest to lowest): Merrimack, Belknap, Strafford, Rockingham, and Sullivan.
Recommended: Tips on Buying a Foreclosed Home
DenisTangneyJr

Ranked 42nd in population, the Pine Tree State placed 40th for highest foreclosure rate. With a total of 737,782 housing units, it saw 77 foreclosures for a foreclosure rate of one in every 9,582 homes. The counties with the most foreclosures per housing unit were (from highest to lowest): Somerset, Waldo, Piscataquis, Penobscot, and Washington.
DepositPhotos.com

Sorted as 37th in population, the Cornhusker State ranked 39th with a foreclosure rate of one in every 9,041 homes. With a total 840,802 housing units, the state had 93 foreclosure filings. The counties with the most foreclosures per housing unit were (from highest to lowest): Nemaha, Frontier, Scotts Bluff, Hamilton, and Seward.
marekuliasz

Listed as 19th in population, the Show-Me State came in 38th for highest rate of foreclosures. Of its 2,782,081 homes, 308 went into foreclosure, making for a foreclosure rate of one in every 9,033 homes. The counties with the most foreclosures per housing unit were (from highest to lowest): Grundy, Gasconade, Mississippi, Buchanan, and Lafayette.
DepositPhotos.com

The eighth-least populous state took the 37th spot for highest foreclosure rate. A total of 54 homes went into foreclosure out of 481,168 total housing units, making the foreclosure rate for the Ocean State one in every 8,911 households. With only five counties in the state, the most foreclosures per housing unit were (from highest to lowest): Providence, Bristol, Washington, Kent, and Newport.
danlogan

The 27th most populous state ranked 36th for highest foreclosure rate. Of the Pacific Wonderland’s 1,798,864 homes, 203 went into foreclosure, making for a foreclosure rate of one in every 8,861 homes. The counties with the most foreclosures per housing unit were (from highest to lowest): Columbia, Klamath, Union, Jackson, and Multnomah.
HaizhanZheng

With 315 foreclosures out of 2,718,369 total housing units, America’s Dairyland and the 20th most populous state had a foreclosure rate of one in every 8,630 households. The counties with the most foreclosures per housing unit were (from highest to lowest): Marquette, Langlade, Taylor, Marinette, and Kenosha.
FierceAbin

The Last Frontier saw 40 foreclosures, making the foreclosure rate one in every 7,895 homes. This caused the third-least populous state, with a total of 315,797 housing units, to secure the 34th spot. Only four boroughs saw foreclosures. The boroughs with the most foreclosures per housing unit were (from highest to lowest): Anchorage, Matanuska-Susitna, Fairbanks North Star, and Kenai Peninsula.
Chilkoot

Ranked 22nd for most populous state, the Land of 10,000 Lakes took the 33rd spot once again for highest foreclosure rate. It has 2,470,483 housing units, of which 333 went into foreclosure, making the state’s foreclosure rate one in every 7,419 households. The counties with the most foreclosures per housing unit were (from highest to lowest): Faribault, Steele, Chisago, Mower, and Wilkin.
JoeChristensen

The Paradise of the Pacific, and the 40th most populous state, came in 32nd for highest foreclosure rate. Of its 556,937 homes, 76 went into foreclosure, making for a foreclosure rate of one in every 7,328 households. Only four of the five counties in the state had foreclosures. They were (from highest to lowest): Honolulu, Maui, Hawaii, and Kauai.
Art Wager

Ranked 34th in population, the Magnolia State experienced 180 foreclosures out of 1,317,375 housing units. This puts the foreclosure rate at one in every 7,319 homes. The counties with the most foreclosures per housing unit were (from highest to lowest): Quitman, Sharkey, Warren, Tunica, and Greene.
Recommended: What Is a Short Sale?
stevegeer

The 12th most populous state ranked 30th for highest foreclosure rate, with 573 homes going into foreclosure. Having 3,596,100 total housing units, the Old Dominion saw a foreclosure rate of one in every 6,276 households. The county and independent cities with the most foreclosures per housing unit were (from highest to lowest): Franklin City, Petersburg City, Martinsville City, Norton City, and Powhatan.
DenisTangneyJr

Sorted as 25th in population, the Pelican State took the 29th spot in January. This means that the state had a foreclosure rate of one in every 6,262 households, with 330 homes out of a total of 2,066,323 housing units going into foreclosure. The parishes with the most foreclosures per housing unit were (from highest to lowest): West Baton Rouge, Iberville, Tangipahoa, Ascension, and Franklin.
DenisTangneyJr

The country’s least populous state claimed the 28th spot for highest foreclosure rate in January. With 271,818 housing units, of which 44 went into foreclosure, the Equality State’s foreclosure rate was one in every 6,178 households. The counties with the most foreclosures per housing unit were (from highest to lowest): Campbell, Platte, Hot Springs, Crook, and Sweetwater.
AnujSahaiPhotography

The 21st most populous state ranked 27th for highest foreclosure rate. Of the Centennial State’s 2,454,873 housing units, 399 went into foreclosure, making for a foreclosure rate of one in every 6,153 homes. The counties with the most foreclosures per housing unit were (from highest to lowest): Kit Carson, Fremont, Rio Grande, Teller, and Baca.
Jacob Boomsma / istockphoto

The 15th most populous state ranked 26th for highest foreclosure rate in January. Of its 2,979,634 housing units, 491 went into foreclosure, making for a foreclosure rate of one in every 6,069 homes. The counties with the most foreclosures per housing unit were (from highest to lowest): Hampden, Plymouth, Berkshire, Bristol, and Worcester.
Rolf_52

Ranked 16th in population, the Volunteer State endured 497 foreclosures out of its 3,011,124 housing units. This puts the foreclosure rate at one in every 6,059 homes and in the 25th spot. The counties with the most foreclosures per housing unit were (from highest to lowest): Humphreys, Hardeman, Houston, Sequatchie, and Lake.
Swarmcatcher

The 36th most populous state claimed the 24th spot for highest foreclosure rate. Of the Land of Enchantment’s 937,397 homes, 168 went into foreclosure, making for a foreclosure rate of one in every 5,580 homes. The counties with the most foreclosures per housing unit were (from highest to lowest): Guadalupe, Eddy, San Miguel, Valencia, and Chaves.
Davel5957

Listed as the 33rd most populous state, the Land of Opportunity took 23rd place for highest foreclosure rate in January. The state has 1,361,880 housing units, of which 251 went into foreclosure, making its latest foreclosure rate one in every 5,426 households. The counties with the most foreclosures per housing unit were (from highest to lowest): Calhoun, Nevada, Lawrence, Little River, and Crittenden.
Tara Ballard

The Keystone State has the 22nd highest foreclosure rate. The fifth-most populous state saw a total of 1,076 housing units out of 5,728,788 homes go into foreclosure, making the state’s foreclosure rate one in every 5,324 households. The counties with the most foreclosures per housing unit were (from highest to lowest): Delaware, Philadelphia, Bucks, Berks, and Montgomery.
AppalachianViews

Listed as 24th in population, the Yellowhammer State came in 21st for highest foreclosure rate. Of its 2,278,526 homes, 439 went into foreclosure, making for a foreclosure rate of one in every 5,190 homes. The counties with the most foreclosures per housing unit were (from highest to lowest): Fayette, Greene, St. Clair, Wilcox, and Coffee.
Recommended: 4 Signs You May Be Ready to Buy
James Deitsch

Sorted as 14th in population, the Grand Canyon State withstood 604 foreclosures out of its 3,056,890 housing units. This puts the foreclosure rate at one in every 5,061 homes. The counties with the most foreclosures per housing unit were (from highest to lowest): Greenlee, Graham, Yuma, Cochise, and Pinal.
wanderluster

The Lone Star State saw 2,340 foreclosures this month. With a foreclosure rate of one in every 4,886 households, this puts the second-most populous state in the U.S., with a whopping 11,433,880 housing units, into 19th place. The counties with the most foreclosures per housing unit were (from highest to lowest): Donley, Scurry, Liberty, Cass, and Webb.
DenisTangneyJr

With 314 of its 1,527,039 homes going into foreclosure, the Constitution State had the 18th highest foreclosure rate at one in every 4,863 households. In the 29th most populous state, the counties that had the most foreclosures per housing unit were (from highest to lowest): Tolland, New Haven, Hartford, Windham, and Litchfield.
traveler1116

The ninth-most populous state claimed 17th place for highest foreclosure rate. Out of 4,673,933 homes, 963 went into foreclosure. This puts the Tar Heel State’s foreclosure rate at one in every 4,854 homes. The counties with the most foreclosures per housing unit were (from highest to lowest): Gates, Jones, Cumberland, Pasquotank, and Clay.
” Darwin Brandis”

The Beehive State placed 16th for highest foreclosure rate. Of its 1,133,558 housing units, 242 homes went into foreclosure, making the 30th most populous state’s foreclosure rate one in every 4,684 households. The counties with the most foreclosures per housing unit were (from highest to lowest): Carbon, Tooele, Juab, Iron, and Millard.
AndreyKrav

The Hawkeye State had the 15th highest foreclosure rate. With 313 housing units out of 1,407,100 homes going into foreclosure, the 31st most populous state’s foreclosure rate was one in every 4,496 homes. The counties with the most foreclosures per housing unit were (from highest to lowest): Clinton, Mahaska, Sac, Pottawattamie, and Warren.
JoeChristensen

With 1,947 out of a total 8,449,178 housing units going into foreclosure, the Empire State claimed the 14th spot in January. The fourth-most populous state’s foreclosure rate was one in every 4,340 households. The counties with the most foreclosures per housing unit were (from highest to lowest): Richmond, Montgomery, Nassau, Putnam, and Herkimer.
Eloi_Omella

Ranked eighth in population, the Peach State acquired the 13th spot for highest foreclosure rate. Of its 4,375,039 homes, 1,071 were foreclosed on. This puts the state’s foreclosure rate at one in every 4,085 households. The counties with the most foreclosures per housing unit were (from highest to lowest): Chattooga, Lee, Bibb, Barrow, and Lamar.
SeanPavonePhoto

The Sooners State claimed the 12th spot in January. With housing units totaling 1,741,721, the 28th most populous state saw 434 homes go into foreclosure at a rate of one in every 4,013 homes. The counties with the most foreclosures per housing unit were (from highest to lowest): Jackson, Tulsa, Woods, Love, and Cotton.
DepositPhotos.com

The third-most populous state in the country has a total of 9,764,897 housing units, of which 2,449 went into foreclosure. The Sunshine State’s foreclosure rate is one in every 3,987 homes. The counties with the most foreclosures per housing unit were (from highest to lowest): Gilchrist, Clay, Union, Duval, and Hardee.
Recommended: Your 2022 Guide to All Things Home
Elisa.rolle

The 17th largest state by population, the Crossroads of America grasped the 10th spot with a foreclosure rate of one in every 3,709 homes. Of its 2,911,562 housing units, 785 homes were foreclosed on in January. The counties with the most foreclosures per housing unit were (from highest to lowest): Sullivan, Morgan, Pulaski, Vanderburgh, and Fayette.
f11photo

With one in every 3,697 homes going into foreclosure, the Palmetto State took the ninth place ranking. The 23rd most populous state has 2,325,248 housing units and saw 629 foreclosure filings. The counties with the most foreclosures per housing unit were (from highest to lowest): Greenwood, Lee, Richland, Lexington, and Kershaw.
SeanPavonePhoto

The country’s most populous state ranked eighth for highest foreclosure rate. Of its impressive 14,328,539 housing units, 4,101 went into foreclosure, making the Golden State’s foreclosure rate one in every 3,494 households. The counties with the most foreclosures per housing unit were (from highest to lowest): Shasta, Mendocino, Calaveras, Kings, and Lake.
mlauffen

The Buckeye State took seventh place in January with a foreclosure rate of one in every 3,078 homes. With a total of 5,232,733 housing units, the seventh-most populous state had a total of 1,700 filings. The counties with the most foreclosures per housing unit were (from highest to lowest): Cuyahoga, Lake, Huron, Butler, and Ross.
dypics

Ranked 32nd in population, the Silver State took the sixth spot for its high foreclosure rate. With one in every 3,002 homes going into foreclosure, and a total of 1,269,846 housing units, the state had 423 foreclosure filings. The counties with the most foreclosures per housing unit were (from highest to lowest): Lincoln, Clark, Washoe, Nye, and Churchill.
AlizadaStudios

Ranked 18th for most populous state, America in Miniature took fifth place for highest foreclosure rate. With a total of 2,516,341 housing units, of which 848 housing units went into foreclosure, the state’s foreclosure rate was one in every 2,967 households. The counties with the most foreclosures per housing unit were (from highest to lowest): Calvert, Kent, Prince George’s County, Dorchester, and Cecil.
James_Lane

With a foreclosure rate of one in every 2,858 homes, the Garden State placed fourth in January. The 11th most populous state has 3,738,342 housing units, of which 1,308 went into foreclosure. The counties with the most foreclosures per housing unit were (from highest to lowest): Cumberland, Salem, Burlington, Camden, and Sussex.
aimintang

Ranked 10th in population, the Wolverine State secured the third spot with a foreclosure rate of one in every 2,617 homes. With a total of 4,566,504 housing units, the state had 1,745 foreclosure filings. The counties with the most foreclosures per housing unit were (from highest to lowest): Wayne, Montcalm, Osceola, Hillsdale, and Ionia.
haveseen

The Land of Lincoln claimed the second spot for highest foreclosure rate. Of its 5,412,995 homes, 2,375 went into foreclosure, making the sixth-most populous state’s foreclosure rate one in every 2,279. The counties with the most foreclosures per housing unit were (from highest to lowest): Macoupin, Washington, Kendall, Madison, and Whiteside.
ibsky

The sixth-least populous state in the country, the Small Wonder took first place in January. With one in every 2,109 homes going into foreclosure and a total 445,104 housing units, the state saw 211 foreclosures filed. With only three counties in the state, the most foreclosures per housing unit were (from highest to lowest): New Castle, Kent, and Sussex.
mdgmorris

Of all 50 states, California had the most foreclosure filings (4,101), and South Dakota had the least (7). As for the states with the highest foreclosure rates, Delaware, Illinois, and Michigan took the top three spots, respectively.
The Great Lakes region had the largest presence among the 10 states that ranked the highest for foreclosure rates. These states were (from highest to lowest): Illinois, Michigan, Ohio, and Indiana.
The Plains region had the largest presence among the 10 states that ranked the lowest for foreclosure rates. These states were (from highest to lowest): Kansas, North Dakota, and South Dakota.
Learn More:
This article originally appeared on SoFi.comand was syndicated by MediaFeed.org.
SoFi Loan Products
SoFi loans are originated by SoFi Lending Corp. or an affiliate (dba SoFi), a lender licensed by the Department of Financial Protection and Innovation under the California Financing Law, license # 6054612; NMLS # 1121636. For additional product-specific legal and licensing information, see our disclosures.
SoFi Home Loans
Terms, conditions, and state restrictions apply. SoFi Home Loans are not available in all states. See our criteria for more information.
External Websites: The information and analysis provided through hyperlinks to third party websites, while believed to be accurate, cannot be guaranteed by SoFi. Links are provided for informational purposes and should not be viewed as an endorsement.
zimmytws / istockphoto

Depositphotos
Featured Image Credit: RomarioIen / iStock.