Vacant homes can come in many different shapes and sizes — and conditions. They are often stereotyped as dilapidated houses with crumbling foundations and boarded-up windows. But they can also be move-in ready just waiting for their next owner.
Regardless of how they look, knowing the number of vacant homes in an area is an important part of understanding the overall health of the local housing market.
Here are the top 10 cities with the highest home vacancy rates:
Image Credit: Stocksy.
10. Memphis, Tennessee
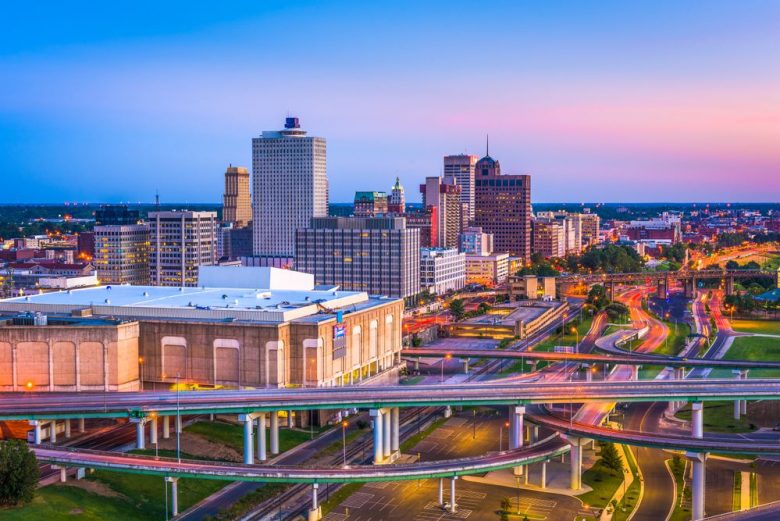
Total households: 565,954
Total occupied households: 495,596
Total vacant households: 70,358
Percent of households that are vacant: 12.43%
Image Credit: DepositPhotos.com.
9. Phoenix
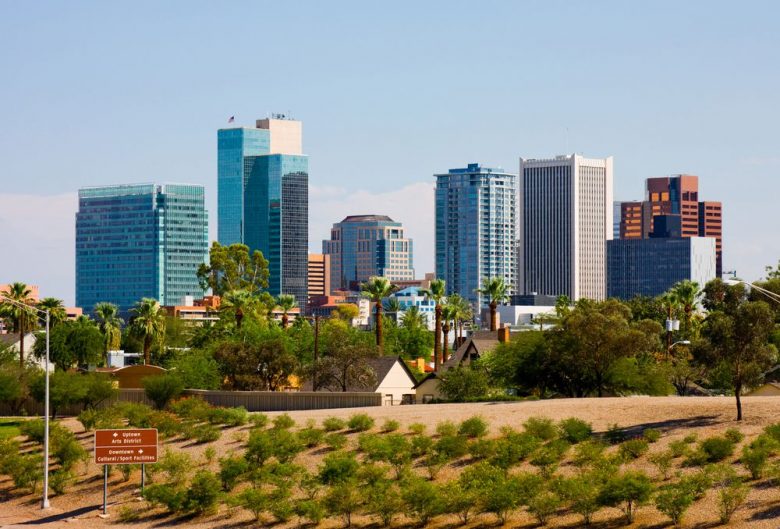
Total households: 1,868,414
Total occupied households: 1,623,046
Total vacant households: 245,368
Percent of households that are vacant: 13.13%
Image Credit: DepositPhotos.com.
8. Riverside, California
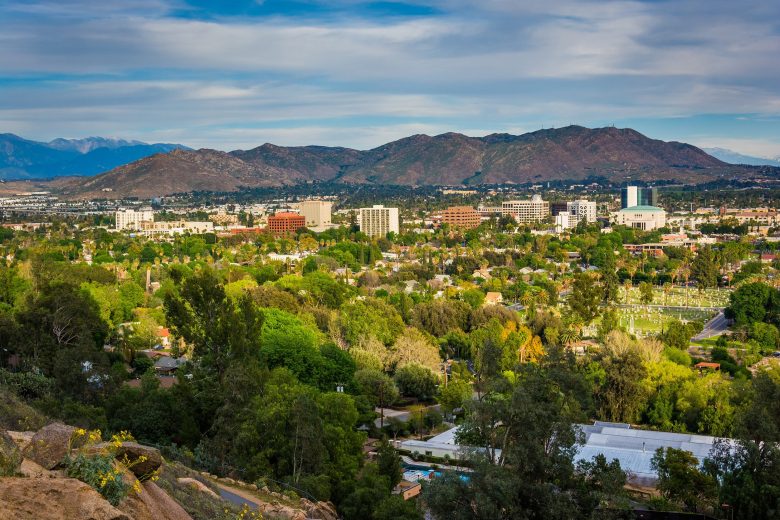
Total households: 1,538,604
Total occupied households: 1,335,366
Total vacant households: 203,238
Percent of households that are vacant: 13.21%
Image Credit: Jon Bilous/shutterstock.
7. New Orleans

Total households: 554,706
Total occupied households: 480,817
Total vacant households: 73,889
Percent of households that are vacant: 13.32%
Image Credit: DepositPhotos.com.
6. Jacksonville, Florida

Total households: 625,888
Total occupied households: 542,219
Total vacant households: 83,669
Percent of households that are vacant: 13.37%
Image Credit: Sean Pavone/istockphoto.
5. Birmingham, Alabama

Total households: 511,456
Total occupied households: 440,261
Total vacant households: 71,195
Percent of households that are vacant: 13.92%
Image Credit: DepositPhotos.com.
4. Las Vegas

Total households: 877,617
Total occupied households: 749,858
Total vacant households: 127,759
Percent of households that are vacant: 14.56%
Image Credit: DepositPhotos.com.
3. Denver

Total households: 1,136,616
Total occupied households: 1,075,807
Total vacant households: 60,809
Percent of households that are vacant: 5.35%
Image Credit: DepositPhotos.com.
2. Minneapolis

Total households: 1,426,299
Total occupied households: 1,355,503
Total vacant households: 70,796
Percent of households that are vacant: 4.96%
Image Credit: DepositPhotos.com.
1. San Jose, California

Total households: 676,737
Total occupied households: 647,891
Total vacant households: 28,846
Percent of households that are vacant: 4.26%
This article originally appeared on LendingTree.com and was syndicated by MediaFeed.org.
Image Credit: Sundry Photography/shutterstock.