
Put Me In, Coach
Everybody loves an underdog, right? Or that player who sat the bench all season, who comes in during the playoffs, and has the game of their life? I know I do. Sometimes markets do too, but betting on the underdog involves more than just luck or chance.
That’s the difference between investing and sports: Athletes may have a single play that defines their whole season, or a game that defines their career.But in investing, we’re looking for more frequent and repeatable wins. Let’s look at some current market underdogs and decide if it’s a good time to place a bet.
(Learn more: Personal Loan Calculator)
Small, but Mighty
The saying “how I cut my teeth” is often used when talking about the early days of someone’s career, referring to the job or the environment where the person first started learning about an industry.
I usually refer to small-cap stocks as a big part of how I cut my teeth. It was the first asset class I wanted to cover, and the one that taught me about portfolio management, and how company fundamentals line up (or don’t) with economic fundamentals. And it was full of company names I’d never heard of, in a market that was less efficient than large-caps and ripe for mispricings. That was exciting to me as a 20-something, and still is today, although my risk appetite is certainly lower in my 40s.
Despite my affinity for small-caps, my philosophical belief that they can offer outsized opportunities, and that they are one of the pillars of the American Dream, even I can admit they’re not always a good buy.
This year has seen major underperformance of small-caps relative to large-caps, leading some to believe that small-caps are due for their moment in the spotlight, and offer attractive relative valuations. While the valuation argument may be true in certain sectors, the idea that small-caps are “due” could be a bit premature.
There have been a couple head fakes this year already: In January the Russell 2000 returned 9.7% while the S&P 500 only returned 6.2%. And from the beginning of June through the end of July the Russell 2000 put up a 14.5% return while the S&P 500 put up 9.8%. Both periods drove market participants to shift their narrative to small-caps keeping up, and sending a pro-cyclical signal.
But in the whole year to date, the S&P 500 is still outperforming the Russell 2000 by 14 percentage points, with the Russell negative on the year and the S&P in double-digit positive territory. How could small-caps have such strong bursts of outperformance yet be trailing by so much over a longer horizon? Because the economic cycle hasn’t supported them yet, and we must respect the cycle.
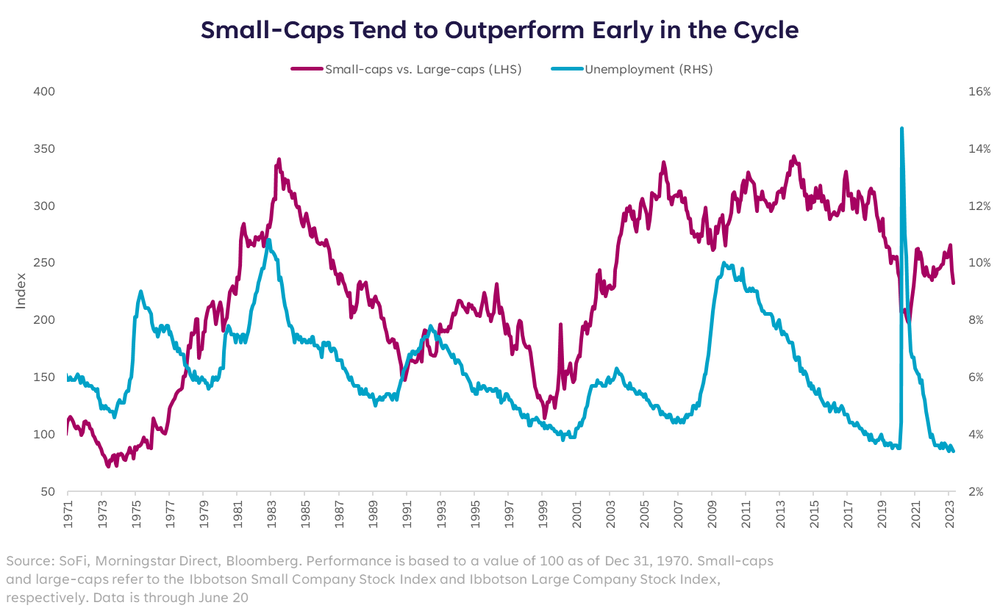
I want small-caps to come back, too, but they tend to see their best relative performance as the unemployment rate is rising at a fast pace, and that’s not the situation we’re currently in. Not only that, but it’s typically when they start a sustainable period of outperformance versus large-caps.
The fact that the labor market has shown such resiliency is a proof point as to why small-caps have tried to rise from the ashes but failed more than once this year. The unemployment rate rises in slowdowns and recessions, just after “late cycle,” and just before we begin “early cycle.” Right now, most economic indicators are still flashing “late cycle”, and that’s also the case with market signals when we compare them to the performance patterns below:
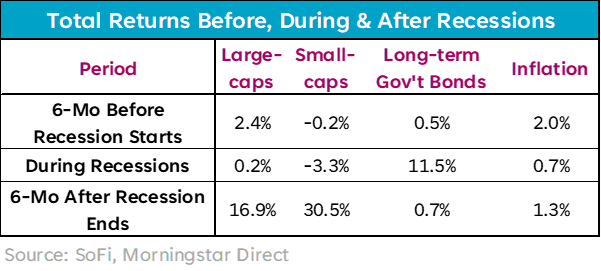
There are clear rotations that are typical of the pre-, during, and post-recession periods. For stocks, large-caps tend to outperform before and during, but trail small-caps after. Long-term government bonds show a clear pattern as well, and it’s one worth noting especially during a time when investors have been pummeled by rising yields and falling prices, with the long-term Treasury ETF (ticker TLT) down more than 15% this year.
Most naysayers will tell you Treasuries won’t protect you in a downturn because this is a new era, and rates have to stay high even if the economy slows. But I’m not one of those naysayers; I think Treasuries can rally across the curve in the event of a negative shock or recessionary environment.
Still unknown though is whether or not we’ll actually have a recessionary environment any time soon.
From the Bench
The last form of underdog I’ll cover this week is to be found in sectors. We frequently talk about sector weights in the index and how much impact, or lack thereof, they can have on broad returns. As the Q3 earnings season heats up, it’s interesting to look at the earnings weight each sector has as compared to its market-cap weight. The biggest dispersions are in Energy, Financials, and Tech.
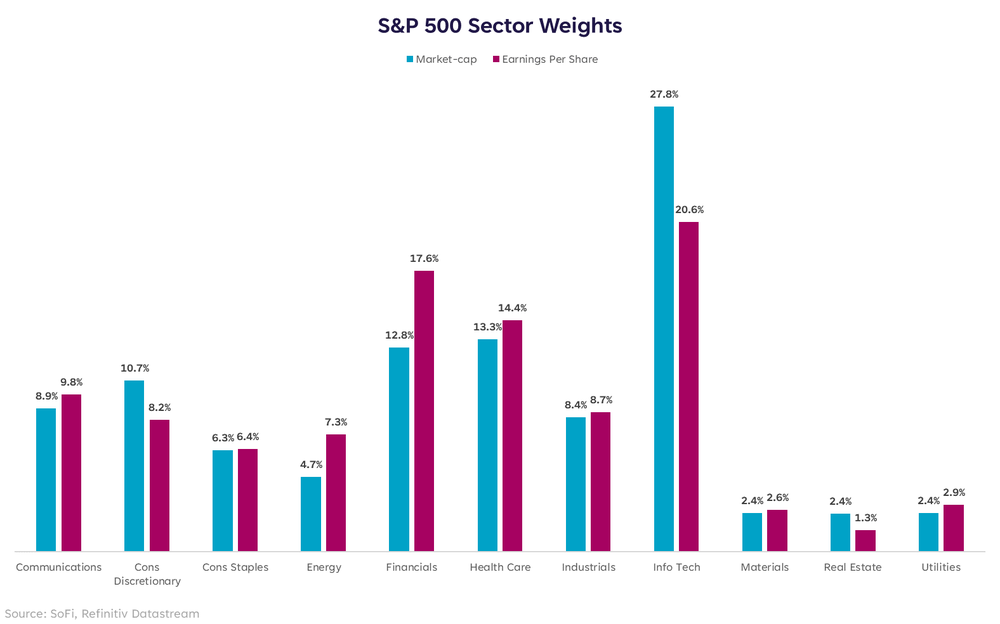
We’ve become accustomed to Tech leading the pack, and it still does so in both categories of weightings, but the chart above shows how much more of an influence Tech has on returns than on earnings.
The underdogs with big dispersions in these weights are Energy and Financials. Both punching above their weight on earnings, but not packing as much of a punch on index returns. That’s ok when the two aren’t performing well, but if there is a market rotation as we move through the business cycle back to early phase expansion, I would expect these underdog sectors to perk up, much like small-caps.
This illustrates how sometimes the earnings headlines don’t line up with index performance, and the market may seem like it’s not trading on fundamentals. On the contrary, the market may be trading on fundamentals, the activity is just masked by sector weights that overpower those moves.
In my opinion, we are still in the late part of the cycle, pre-contraction, and even more pre-early cycle. As we move through the phases, market performance is likely going to change, and some of these dispersions may narrow, or even invert. The moral of the story remains: respect the cycle, and rely on logic, not chance.
This article originally appeared on SoFi.com and was syndicated by MediaFeed.org.
Communication of SoFi Wealth LLC an SEC Registered Investment Adviser. Information about SoFi Wealth’s advisory operations, services, and fees is set forth in SoFi Wealth’s current Form ADV Part 2 (Brochure), a copy of which is available upon request and at adviserinfo.sec.gov. Liz Young is a Registered Representative of SoFi Securities and Investment Advisor Representative of SoFi Wealth. Her ADV 2B is available at sofi.
More from MediaFeed:
Foreclosure rates make the home market a house of cards in these states

While foreclosures may have dropped overall compared to October, several major cities have maintained their high foreclosure rates. Foreclosure filings in metropolises like Cleveland, OH and Chicago, IL have skyrocketed since 2021, and a decline is not likely in the foreseeable future.
But it’s not just urban areas that are experiencing this nationwide trend. According to the experts at ATTOM Data Solutions, the number of U.S. housing units coast-to-coast that have gone into foreclosure has increased by a startling 57% since this time last year. While there was a slight dip in filings between October and November, slipping to 30,677 from 32,376 foreclosed homes, this only amounts to a 5% decline.
While mortgage rates seem to have peaked in October, the prices remain uncomfortably high, especially when compared to pre-pandemic numbers. Standard rates for both 10-year and 30-year fixed mortgages have varied this past year, however for the most part the rate is steadily rising. Currently at roughly 6.3%, the average interest rate for a traditional 30-year fixed mortgage has increased more than twofold from last year’s 3%. The primary driver behind this trend is the Federal Reserve’s decision to raise its own interest rate to combat inflation.
The housing industry has been flipped on its head by high mortgage rates, which have caused a dramatic cooling of a once-hot market. Even though home prices are declining in certain regions, this may not be enough to offset the extra costs that homeowners must pay due to rising mortgage rates.
Read on for the foreclosure rates in November 2022 – plus the five counties or county equivalents with the highest rates within those states.
Related: The safest cities in the US
damircudic/istockphoto

As previously noted, foreclosure rates decreased slightly compared to last month, but are up significantly compared to last year. Read on for November foreclosure rates for all 50 states — plus the District of Columbia — beginning with the state that had the lowest rate of foreclosure filings per housing unit.
DepositPhotos.com

Ranking in population between Vermont and Alaska, the country’s second-and-third-least populous states, Washington, D.C. had 43 foreclosures in November, a substantial dip compared to October’s 68. With a total of 350,364 housing units, the foreclosure rate of the Nation’s Capital was one in every 8,148 households, putting it in between the states of Alaska (#36) and Missouri (#37).
DepositPhotos.com

Unsurprisingly, the Mount Rushmore State nabbed the 50th spot for its November foreclosure rate for the third month in a row. Having 389,921 total housing units, the fifth-least populous state had a foreclosure rate of one in every 97,480 households with four foreclosures. Only one county in South Dakota saw any foreclosures: Minnehaha.
RiverNorthPhotography

In 49th place for population, the Green Mountain State maintained its 49th rank for foreclosure rate as well. Of the state’s 334,318 housing units, 17 homes went into foreclosure at a rate of one in every 19,666 households. The counties with the most foreclosures per housing unit were (from highest to lowest): Bennington, Rutland, Washington, Windham, and Caledonia.
DenisTangneyJr

The Peace Garden State’s foreclosure rate was one in every 15,443 homes. This puts the fourth-least populous state – with 370,642 housing units and 24 foreclosures — in 48th place, a slight improvement from last month’s 41st spot. The counties with the most foreclosures per housing unit were (from highest to lowest): Traill, Walsh, Morton, Ward, and Grand Forks.
sequential5

Ranked 38th in population, the Gem State earned the 47th spot as 56 of its homes went into foreclosure in November. With 751,859 total housing units, the state’s foreclosure rate was one in every 13,426 households. The counties with the most foreclosures per housing unit were (from highest to lowest): Lewis, Lincoln, Payette, Twin Falls, and Clearwater.
knowlesgallery

Sorted as 13th in population, the Evergreen State ranked 46th for highest foreclosure rate. It has 3,202,241 housing units, of which 248 went into foreclosure, making the state’s foreclosure rate one in every 12,912 households. The counties with the most foreclosures per housing unit were (from highest to lowest): Lewis, Grays Harbor, Adams, Kitsap, and Cowlitz.
4nadia

With a total of 1,994,323 housing units, the Bluegrass State saw 168 homes go into foreclosure, sustaining its 45th ranking from September and October. This puts the foreclosure rate for the 26th most populous state at one in every 11,871 households. The counties with the most foreclosures per housing unit were (from highest to lowest): Fulton, Boyd, Greenup, Carlisle, and Bath.
Thomas Kelley

New Hampshire, the 41st most populous state, ranked 44th for highest foreclosure rate. The granite state saw 62 of its 638,795 homes go into foreclosure, making for a foreclosure rate of one in every 10,303 households. The counties with the most foreclosures per housing unit were (from highest to lowest): Belknap, Cheshire, Hillsborough, Rockingham, and Sullivan.
DenisTangneyJr

Ranked 39th in population, the Mountain State earned the 43rd spot this month. It has 855,635 housing units, of which 84 went into foreclosure. This means that the foreclosure rate was one in every 10,186 homes. The counties with the most foreclosures per housing unit were (from highest to lowest): Hancock, Pleasants, Wood, Fayette, and Kanawha.
hkim39 // istockphoto

The Sunflower State ranked 42nd in November, a rise compared to last month’s 47th spot. With 1,275,689 homes and a total of 127 housing units going into foreclosure, the 35th most populous state’s foreclosure rate was one in every 10,045 households. The counties with the most foreclosures per housing unit were (from highest to lowest): Haskell, Kingman, Woodson, Norton, and Rooks.
Tiago_Fernandez / istockphoto
With 285 foreclosures out of 2,727,726 total housing units, America’s Dairyland and the 20th most populous state had a foreclosure rate of one in every 9,571 households. The counties with the most foreclosures per housing unit were (from highest to lowest): Iron, Marquette, Kenosha, Richland, and Langlade.
Recommended: Tips on Buying a Foreclosed Home
sequential5

Listed as 44th in population, the Treasure State took the 40th spot. With 57 foreclosures out of 514,803 housing units, its foreclosure rate was one in every 9,032 homes. The counties with the most foreclosures per housing unit were (from highest to lowest): Fallon, Chouteau, Rosebud, Dawson, and Big Horn.
YinYang

Ranked 34th in population, the Magnolia State experienced 156 foreclosures out of 1,319,945 housing units. This puts the foreclosure rate at one in every 8,461 homes. The counties with the most foreclosures per housing unit were (from highest to lowest): Itawamba, Humphreys, Simpson, Copiah, and Hancock.
stevegeer

The eighth-least populous state took the 38th spot for highest foreclosure rate. A total of 58 homes went into foreclosure out of 483,474 total housing units, making the foreclosure rate for the Ocean State one in every 8,336 households. With only five counties in the state, the most foreclosures per housing unit were (from highest to lowest): Bristol, Providence, Newport, Kent, and Washington.
danlogan

Listed as 19th in population, the Show-Me State came in 37th for highest rate of foreclosures. Of its 2,786,621 homes, 336 went into foreclosure, making for a foreclosure rate of one in every 8,294 homes. The counties with the most foreclosures per housing unit were (from highest to lowest): Webster, Mississippi, Barton, Gentry, and Laclede.
DepositPhotos.com

The Last Frontier saw 42 foreclosures, making the foreclosure rate one in every 7,560 homes. This caused the third-least populous state, with a total of 317,524 housing units, to secure the 36th spot. Only four boroughs saw foreclosures. The boroughs with the most foreclosures per housing unit were (from highest to lowest): Matanuska-Susitna, Anchorage, Fairbanks North Star, and Kenai Peninsula.
Chilkoot

Ranked 16th in population, the Volunteer State endured 409 foreclosures out of its 3,031,605 housing units. This puts the foreclosure rate at one in every 7,412 homes and in the 35th spot. The counties with the most foreclosures per housing unit were (from highest to lowest): Hardin, Humphreys, Obion, Rhea, and Hickman.
Swarmcatcher

The 27th most populous state ranked 34th for highest foreclosure rate. Of the Pacific Wonderland’s 1,813,747 homes, 255 went into foreclosure, making for a foreclosure rate of one in every 7,113 homes. The counties with the most foreclosures per housing unit were (from highest to lowest): Lake, Crook, Josephine, Klamath, and Linn.
HaizhanZheng

The 21st most populous state ranked 33rd for highest foreclosure rate. Of the Centennial State’s 2,491,404 housing units, 380 went into foreclosure, making for a foreclosure rate of one in every 6,556 homes. The counties with the most foreclosures per housing unit were (from highest to lowest): Mesa, Teller, Archuleta, Morgan, and Pueblo.
Postoak at English Wikipedia

Ranked 22nd for most populous state, the Land of 10,000 Lakes took the 32nd spot for highest foreclosure rate. It has 2,485,558 housing units, of which 386 went into foreclosure, making the state’s foreclosure rate one in every 6,439 households. The counties with the most foreclosures per housing unit were (from highest to lowest): Faribault, Mower, Waseca, St. Louis, and Wilkin.
JoeChristensen

Sorted as 37th in population, the Cornhusker State ranked 31st with a foreclosure rate of one in every 6,396 homes. With a total 844,278 housing units, the state had 132 foreclosure filings. The counties with the most foreclosures per housing unit were (from highest to lowest): Webster, Hitchcock, Kearney, Frontier, and Nemaha.
Recommended: What Is a Short Sale?
marekuliasz

The 12th most populous state ranked 30th for highest foreclosure rate, with 575 homes going into foreclosure. Having 3,618,247 total housing units, the Old Dominion saw a foreclosure rate of one in every 6,293 households. The county and independent cities with the most foreclosures per housing unit were (from highest to lowest): Colonial Heights City, Martinsville City, Buena Vista City, Portsmouth City, and Giles.
DenisTangneyJr

Sorted as 14th in population, the Grand Canyon State withstood 493 foreclosures out of its 3,082,000 housing units. This puts the foreclosure rate at one in every 6,252 homes. The counties with the most foreclosures per housing unit were (from highest to lowest): Santa Cruz, Cochise, La Paz, Pinal, and Graham.
wanderluster

Ranked 42nd in population, the Pine Tree State placed 28th for highest foreclosure rate. With a total of 739,072 housing units, it saw 123 foreclosures for a foreclosure rate of one in every 6,009 homes. The counties with the most foreclosures per housing unit were (from highest to lowest): Waldo, Oxford, Penobscot, Knox, and Franklin.
DepositPhotos.com

The Beehive State placed 27th for highest foreclosure rate. Of its 1,151,414 housing units, 192 homes went into foreclosure, making the 30th most populous state’s foreclosure rate one in every 5,997 households. The counties with the most foreclosures per housing unit were (from highest to lowest): Carbon, Millard, Box Elder, Beaver, and Tooele.
AndreyKrav

The 15th most populous state ranked 26th for highest foreclosure rate. Of 2,998,537 housing units, 506 went into foreclosure, making for a foreclosure rate of one in every 5,926 homes. The counties with the most foreclosures per housing unit were (from highest to lowest): Worcester, Hampden, Bristol, Franklin, and Hampshire.
Rolf_52

The Paradise of the Pacific, and the 40th most populous state, came in 25th for highest foreclosure rate. Of its 561,066 homes, 98 went into foreclosure, making for a foreclosure rate of one in every 5,725 households. Only four of the five counties in the state had foreclosures. They were (from highest to lowest): Hawaii, Honolulu, Kauai, and Maui.
SEASTOCK/iStock

The ninth-most populous state claimed 24th place for highest foreclosure rate, an upturn from last month’s 7th spot. Out of 4,708,710 homes, 852 went into foreclosure. This puts the Tar Heel State’s foreclosure rate at one in every 5,527 homes. The counties with the most foreclosures per housing unit were (from highest to lowest): Northampton, Nash, Pasquotank, Cherokee, and Tyrrell.
” Darwin Brandis”

The Keystone State has the 23rd highest foreclosure rate. The fifth-most populous state saw a total of 1,060 housing units out of 5,742,828 homes go into foreclosure, making the state’s foreclosure rate one in every 5,418 households. The counties with the most foreclosures per housing unit were (from highest to lowest): Delaware, Philadelphia, Berks, Bucks, and Lancaster.
AppalachianViews

Sorted as 25th in population, the Pelican State took the 22nd spot, an unfavorable contrast to last month’s 32nd ranking. This means that the state had a foreclosure rate of one in every 5,170 households, with 401 homes out of a total of 2,073,200 housing units going into foreclosure. The parishes with the most foreclosures per housing unit were (from highest to lowest): West Baton Rouge, Tangipahoa, Plaquemines, DeSoto, and Livingston.
DenisTangneyJr

Listed as the 33rd most populous state, the Land of Opportunity took 21st place for highest foreclosure rate in November, an improvement over last month’s 15th ranking. The state has 1,365,265 housing units, of which 271 went into foreclosure, making the state’s latest foreclosure rate one in every 5,038 households. The counties with the most foreclosures per housing unit were (from highest to lowest): Lincoln, Poinsett, Jackson, Franklin, and Mississippi.
Recommended: 4 Signs You May Be Ready to Buy
Bentonville Arkansas by Alfredo Carrillo (CC BY)

The Lone Star State saw 2,303 foreclosures this month. With a foreclosure rate of one in every 5,032 households, this puts the second-most populous state in the U.S., with a whopping 11,589,324 housing units, into the 20th spot yet again. The counties with the most foreclosures per housing unit were (from highest to lowest): Cochran, Ector, Liberty, Kinney, and Shackelford.
DenisTangneyJr

The 36th most populous state claimed the 19th spot for highest foreclosure rate. Of the Land of Enchantment’s 940,859 homes, 187 went into foreclosure, making for a foreclosure rate of one in every 5,031 homes. The counties with the most foreclosures per housing unit were (from highest to lowest): Valencia, Chaves, Eddy, Bernalillo, and Sandoval.
Davel5957

With 317 of its 1,530,197 homes going into foreclosure, the Constitution State once again had the 18th highest foreclosure rate at one in every 4,827 households. In the 29th most populous state, the counties that had the most foreclosures per housing unit were (from highest to lowest): Windham, Litchfield, Hartford, Tolland, and Fairfield.
traveler1116

Ranked 10th in population, the Wolverine State secured the 17th spot with a foreclosure rate of one in every 4,259 homes. With a total of 4,570,173 housing units, the state had 1,073 foreclosure filings. The counties with the most foreclosures per housing unit were (from highest to lowest): Shiawassee, Wexford, St. Joseph, Lenawee, and Monroe.
haveseen

The country’s most populous state ranked 16th for highest foreclosure rate. Of its impressive 14,392,140 housing units, 3,483 went into foreclosure, making the Golden State’s foreclosure rate one in every 4,132 households. The counties with the most foreclosures per housing unit were (from highest to lowest): Siskiyou, Trinity, Lake, Yuba, and Kern.
mlauffen

The Hawkeye State had the 15th highest foreclosure rate. With 346 housing units out of 1,412,789 homes going into foreclosure, the 31st most populous state’s foreclosure rate was one in every 4,083 homes. The counties with the most foreclosures per housing unit were (from highest to lowest): Des Moines, Emmet, Henry, Fremont, and Union.
JoeChristensen

Listed as 24th in population, the Yellowhammer State came in 14th for highest foreclosure rate. Of its 2,288,330 homes, 567 went into foreclosure, making for a foreclosure rate of one in every 4,036 homes. The counties with the most foreclosures per housing unit were (from highest to lowest): Coosa, Jefferson, Covington, Walker, and Calhoun.
James Deitsch

The third-most populous state in the country has a total of 9,865,350 housing units, of which 2,513 went into foreclosure. The Sunshine State’s foreclosure rate is one in every 3,926 homes. The counties with the most foreclosures per housing unit were (from highest to lowest): Bradford, Union, Clay, Escambia, and Palm Beach.
Elisa.rolle

The Sooners State claimed the 12th spot, a sizable disappointment compared to October’s 31st ranking. With housing units totaling 1,746,807, the 28th most populous state saw 448 homes go into foreclosure at a rate of one in every 3,899 homes. The counties with the most foreclosures per housing unit were (from highest to lowest): Tulsa, Garfield, Canadian, Dewey, and Cleveland.
DepositPhotos.com

Ranked 18th for most populous state, America in Miniature took 11th place for highest foreclosure rate. With a total of 2,530,844 housing units, of which 670 housing units went into foreclosure, the state’s foreclosure rate was one in every 3,777 households. The counties with the most foreclosures per housing unit were (from highest to lowest): Charles, Dorchester, Caroline, Cecil, and Washington.
Recommended: Your 2022 Guide to All Things Home
James_Lane

Ranked eighth in population, the Peach State acquired the 10th spot for highest foreclosure rate. Of its 4,410,956 homes, 1,182 were foreclosed on. This puts the state’s foreclosure rate at one in every 3,732 households. The counties with the most foreclosures per housing unit were (from highest to lowest): Calhoun, Turner, Newton, Walton, and Liberty.
SeanPavonePhoto

With 2,296 out of a total 8,488,066 housing units going into foreclosure, the Empire State claimed the 9th spot in November. The fourth-most populous state’s foreclosure rate was one in every 3,697 households. The counties with the most foreclosures per housing unit were (from highest to lowest): Washington, Chautauqua, Suffolk, St. Lawrence, and Putnam.
Eloi_Omella

The 17th largest state by population, the Crossroads of America grasped the eighth spot with a foreclosure rate of one in every 3,419 homes. Of its 2,923,175 housing units, 855 homes were foreclosed on in November. The counties with the most foreclosures per housing unit were (from highest to lowest): Jennings, Fountain, Vermillion, Sullivan, and Morgan.
f11photo

Ranking 32nd in population, the Silver State took the seventh spot for foreclosure rate. With one in every 3,319 homes going into foreclosure, and a total of 1,281,018 housing units, the state had 386 foreclosure filings. The counties with the most foreclosures per housing unit were (from highest to lowest): White Pine, Clark, Lander, Nye, and Humboldt.
AlizadaStudios

The Buckeye State took sixth place yet again in November with a foreclosure rate of one in every 3,238 homes. With a total of 5,242,524 housing units, the seventh-most populous state had a total of 1,619 filings. The counties with the most foreclosures per housing unit were (from highest to lowest): Jefferson, Huron, Cuyahoga, Columbiana, and Harrison.
espiegle/iStock

The country’s least populous state surprisingly claimed the 5th spot for highest foreclosure rate in November, a drastic change from October’s 44th ranking. With 271,887 housing units, of which 84 went into foreclosure, the Equality State’s foreclosure rate was one in every 3,237 households. The counties with the most foreclosures per housing unit were (from highest to lowest): Platte, Campbell, Carbon, Natrona, and Sublette.
dschreiber29

With one in every 3,195 homes going into foreclosure, the Palmetto State obtained the fourth ranking once again. The 23rd most populous state has 2,344,963 housing units and saw 734 foreclosure filings. The counties with the most foreclosures per housing unit were (from highest to lowest): Orangeburg, Colleton, Kershaw, Dorchester, and Lexington.
SeanPavonePhoto

With a foreclosure rate of one in every 2,916 homes, the Garden State placed third for, ironically, the third time in a row. The 11th most populous state has 3,761,229 housing units, of which 1,290 went into foreclosure. The counties with the most foreclosures per housing unit were (from highest to lowest): Gloucester, Cumberland, Salem, Camden, and Sussex.
JERRYE / Wiki Commons

The sixth-least populous state in the country, the Small Wonder maintained its second place spot from October. With one in every 2,736 homes going into foreclosure and a total 448,735 housing units, the state saw 164 foreclosure filed. With only three counties in the state, the most foreclosures per housing unit were (from highest to lowest): Kent, New Castle, and Sussex.
istockphoto

The Land of Lincoln made the top spot for highest foreclosure rate for the fourth month in a row, the longest of any state. Of its 5,426,429 homes, 2,260 went into foreclosure, making the sixth-most populous state’s foreclosure rate one in every 2,401. The counties with the most foreclosures per housing unit were (from highest to lowest): Mason, Livingston, Rock Island, Logan, and Marshall.
ibsky

Of all 50 states, California had the most foreclosure filings (3,483), and South Dakota had the least (4). As for the states with the highest foreclosure rates, Illinois, Delaware, and New Jersey took the top three spots, respectively.
Two regions – The Great Lakes and the Mideast – tied for having the largest presence among the 10 states that ranked the highest for foreclosure rates. The states in the Great Lakes region were (from highest to lowest): Illinois, Ohio, and Indiana. The states in the Mideast region were (from highest to lowest): Delaware, New Jersey, and New York.
The Plains region had the largest presence among the 10 states that ranked the lowest for foreclosure rates. The states were (from highest to lowest): Kansas, North Dakota, and South Dakota.
Learn More:
This article originally appeared on SoFi.comand was syndicated by MediaFeed.org.
SoFi Loan Products
SoFi loans are originated by SoFi Lending Corp. or an affiliate (dba SoFi), a lender licensed by the Department of Financial Protection and Innovation under the California Financing Law, license # 6054612; NMLS # 1121636. For additional product-specific legal and licensing information, see our disclosures.
SoFi Home Loans
Terms, conditions, and state restrictions apply. SoFi Home Loans are not available in all states. See our criteria for more information.
External Websites: The information and analysis provided through hyperlinks to third party websites, while believed to be accurate, cannot be guaranteed by SoFi. Links are provided for informational purposes and should not be viewed as an endorsement.
zimmytws / istockphoto

Depositphotos
Featured Image Credit: standret/istockphoto.


