
In the Playoffs
Green Bay Packer fans are still riding the high of last weekend’s wild card win over the Dallas Cowboys, and rightfully so as the Pack became the only #7 seed to ever win a playoff game. Much like our experience with markets, no one predicted that game to go the way it did. And as with markets, one of the things we can count on every year is that there will be surprises.
Since we can’t predict what those surprises will be, the best we can do at the beginning of a year is make sure we have our team ready. In order for a team to succeed in the playoffs, both the offense and defense have to show up. This isn’t unlike allocating a portfolio, particularly in a year when the environment is likely to shift from monetary tightening to monetary easing, and the outcome of that shift is yet to be seen. As we learned in the Packers/Cowboys game, the outcome that most people expect to happen tends to be the one that doesn’t happen.
At its most basic level, the concept of offense and defense in a portfolio is the standard 60/40 allocation with 60% stocks and 40% bonds. The idea being that volatility in stocks can be dampened or offset by the more stable and defensive nature of fixed income. A blended portfolio should ideally provide a less volatile return pattern than a portfolio of 100% stocks, while still offering upside potential.
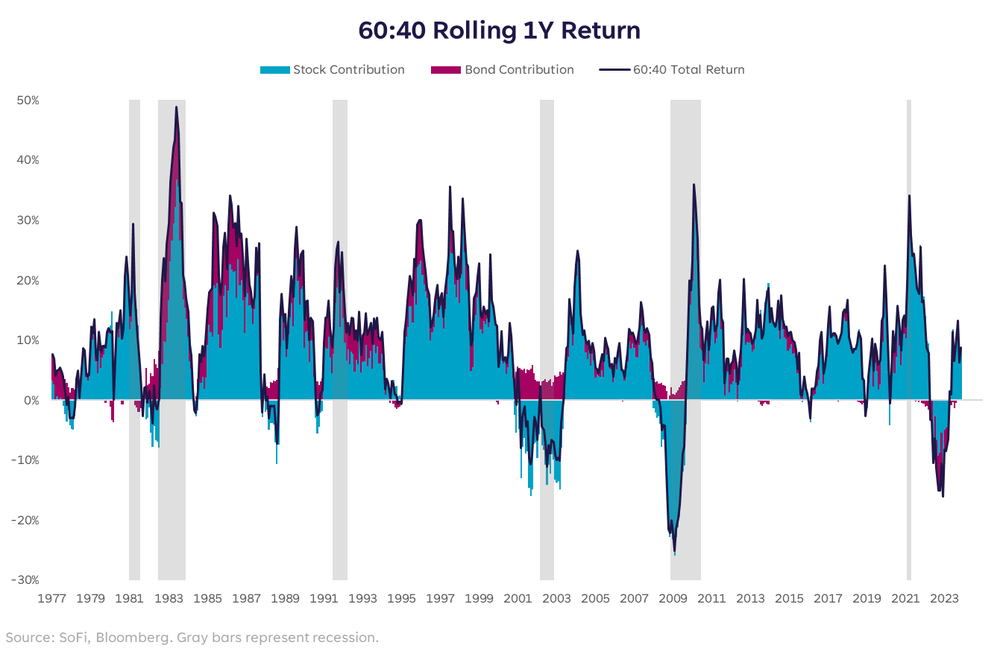
Despite a period of time when the crowd was shouting that 60/40 was dead, it has made a comeback and is again something investors can broadly consider. However, it’s important to drill down even deeper and identify the sectors and asset classes within broad categories that can play offense or defense, and have the potential to play well in 2024.
Points on the Board
One of the most frustrating charts to see right now is that of the S&P 500 from the beginning of 2022 to the beginning of 2024. We’ve had two very eventful years in markets, yet the index is basically back to exactly where it was in January 2022. Some may say the last two years were lost, but most investors don’t simply own the S&P 500, so the range of outcomes was wide depending on your timing and positioning.
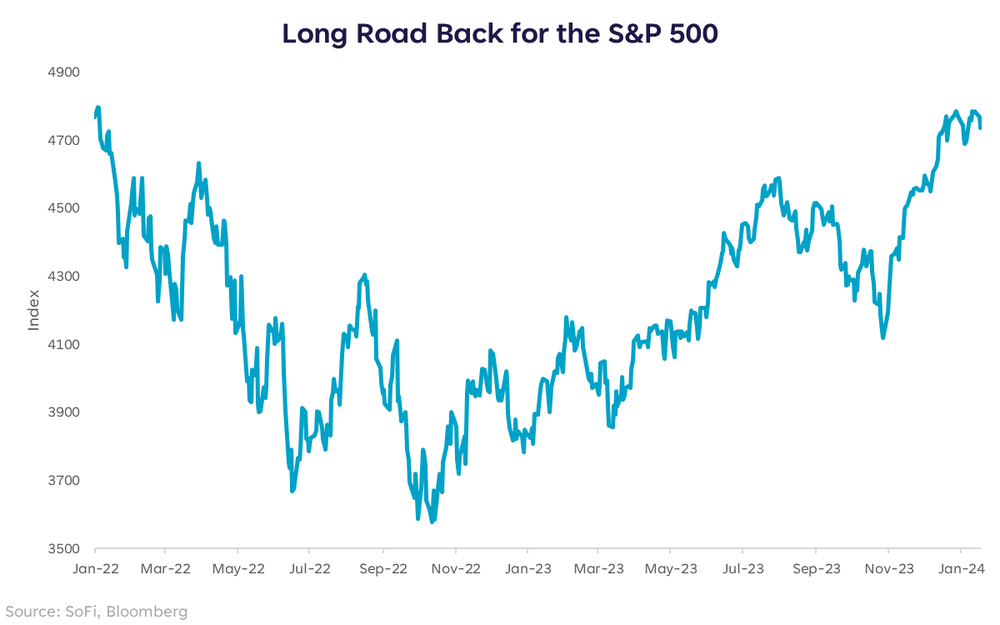
In any event, we could also look at it as a clean slate. We’ve basically returned to the level we were at before recession fears were priced in. And since the prospect of not having a recession at all has become more commonplace, it’s rational to make sure your portfolio has an allocation to areas that can produce upside in the case of continued growth and no major drawdown.
As someone who’s been cautious for quite a while on the expectation that tightening would eventually result in economic pain, and that markets are not appreciating that risk enough, I also recognize that being present in markets is the only way to make money.
Offensive plays do not need to be hail mary passes or 75-yard punt returns. They can be a series of first downs that bring the ball across the field more methodically, while still resulting in the same number of points. In 2024, that’s the approach I would take on offense, and the spots I like in that bucket are large cap cyclical sectors such as Industrials and Financials, the Nasdaq 100, and Health Care.
More specifically, I would expect these areas to do well in the case of another period that seems to be late cycle behavior, but absent a recession. The cyclical sectors would have a chance to shine in an environment of continued spending and no major labor market concerns, while the Nasdaq 100 continues to be the darling of this cycle and is likely to do well on the expectation (or reality) of falling rates without a major contraction in growth.
Health Care is more of a contrarian play given that it tends to struggle during election years, and was one of the worst performing sectors in 2023. But these are peculiar times, so I’m willing to try a peculiar play. Health Care can be seen as defensive in the large cap space, but it’s also benefiting from growth and innovation in Pharma & Biotech, which I expect to continue in 2024. Not to mention, it’s a growth area of the market that isn’t nearly as sensitive to interest rate volatility as Technology, Communications, and Consumer Discretionary.
Defense Wins Games
Offense is important, but you don’t make it all the way without keeping an eye on risk management and protection. With that in mind, a portfolio in 2024 requires defense against the possibility of a drop in yields, a reignition of recession fears, or a reacceleration in inflation. Since the defense portion of a portfolio is one I’ve covered many times before, this part is pretty straightforward.
The difference in 2024 is that we are expecting the Fed to start cutting rates (when and by how much is a topic for another column), which could start to make those high yielding, low risk assets such as Money Market Funds (MMFs) less attractive as the year goes on. For the time being, MMFs are still generating attractive income. But if rates fall throughout the year, investors may want to consider other assets that can offer a yield and some price potential in times of stress.
Those assets in my opinion would be dividend paying stocks and Treasurys. I particularly like short-term Treasurys right now, but 10-year Treasurys can be an attractive asset for those worried about recession. As for dividend stocks, stay tuned for next week’s column that will be written by my research partner Mario… on dividend stocks.
Lastly, although we’ve made considerable progress on inflation, the risk of it heating up again remains. As such, investors may benefit from an allocation to precious metals and commodities. More specifically, I like Gold as both an inflation hedge and a stable defensive position. Other commodities such as Copper, Oil, and Lumber could have potential to rise if inflation does move higher again. A broad commodity basket would be my preferred way to own this part of the market in a diversified manner, keeping in mind that although I’m putting this in the “defense” bucket here, commodities tend to be cyclical and can be volatile in times of stress.
Next Round
We’re only halfway through January with a lot of year left, so it’s important to balance risks and opportunities, while keeping an eye on what the next surprise may be. In a period when the range of possible outcomes is wide, let’s start the game with balance and agility.
This article originally appeared on SoFi.com and was syndicated by MediaFeed.org.
Communication of SoFi Wealth LLC an SEC Registered Investment Adviser. Information about SoFi Wealth’s advisory operations, services, and fees is set forth in SoFi Wealth’s current Form ADV Part 2 (Brochure), a copy of which is available upon request and at adviserinfo.sec.gov. Liz Young is a Registered Representative of SoFi Securities and Investment Advisor Representative of SoFi Wealth. Her ADV 2B is available at sofi
More from MediaFeed:
The average American debt by age

Americans are carrying a record amount of debt lately. Just last summer, the Federal Reserve Bank of New York announced that U.S. citizens hit a new milestone: $1 trillion in credit card debt. And when you look at overall debt, the number soars to an eye-watering $17 trillion, with the typical American having $21,000-plus in personal debt (not including mortgages).
Debt seems to be woven into everyday life. Yes, inflation is down from the scary heights of 2020 and 2021, but it’s still an issue for many. And the overall cost of living is climbing, too, which may be why Americans are taking on more debt. A person has to eat, right, and live their life? Debt can be what gets people through.
Taking a closer look at how debt is tracking by age can help as you examine your own situation and think carefully about how you will manage your own debt load.
Here, you’ll learn more about the latest Federal Reserve and U.S. Census Bureau data and what it reveals about how Americans are using credit. Overall, people in their high earning years (early middle age) carry the most debt, typically in the form of mortgages, while younger families carry more student loan debt. Let’s take a closer look.
Ridofranz

Percentage of families with debt: 81%
Total median debt per household: $39,200
For the millennials, education debt reigns. Forty-four percent of young households hold student loan debt compared to 28.3% with mortgage debt. This tells us that people in this age range are likely putting off home ownership due to the burden of student loans. The median student loan debt was $18,500 while the mean student loan debt was $33,000. That can add up to a hefty monthly payment that could discourage taking on a mortgage loan as well.
Nearly half of millennial households are also carrying a credit card balance from month to month at a median of $1,400. Paying interest on high credit card balances can quickly eat away at income — and savings.
shironosov/istockphoto

Percentage of families with debt: 86.2%
Total median debt per household: $93,700
As you can see, families in this age range have taken on more debt. In this bracket, education debt has increased (median: $20,000) but the percentage of families with student loans has dropped to 34%. Instead, mortgage debt accounts for much of the overall debt increase. Fifty percent of households have mortgage debt in this age bracket, with a median housing debt of $93,700. Their credit card debt is climbing too, with 49% carrying a median $2,500.
These increases show that people in this age range are taking on more debt — likely because they’re earning more and doing more: they’re settling into their careers, buying houses, and starting families.
Jacob Wackerhausen/istockphoto

Percentage of families with debt: 86.6%
Total median debt per household: $89,900
Most households that are firmly in middle age continue to hold debt, but the amount of debt is much less than younger households. Fewer hold student loan debt (24%, median: $20,000), and about the same number have mortgages (53%), but the amount they owe is less (median: $125,000).
There are a couple of possible explanations for this: one is that they’re earning more and have had more time to pay off their student loans and mortgages. The other is that this generation missed some of the soaring higher education costs that younger generations have had to grapple with.
They also likely entered the workforce and established their careers before the recession, while younger generations are more likely to have been hit hard by career-stalling hiring freezes and wage cuts as they were just starting out. In short, this generation and those in older households haven’t necessarily had to depend on financing as much as younger generations to get their adult lives started.
Drazen Zigic/istockphoto

Percentage of families with debt: 77.1
Total median debt per household: $69,000
This age bracket continues to see drops in overall debt. They owe less on their mortgages and even less on education loans. With fewer large expenses related to education, housing, and family rearing, households in this age bracket can focus on paying down debt and building savings as they prepare for retirement.
(Learn more: Personal Loan Calculator)
PeopleImages/istockphoto

Percentage of families with debt: 70.1%
Total median debt per household: $42,000
Households in this age range are likely beginning to or have begun their retirement. At this point, they are probably tightening their budgets to live on retirement savings, pensions, and social security. As a result, they’re spending — and borrowing less.
Despite lower mortgage and education debt, 42% of households are carrying a pretty high balance on credit cards (median: $2,500). This suggests that for smaller purchases, people rely heavily on this convenient, yet high-interest form of borrowing.
g-stockstudio/istockphoto

Percentage of families with debt: 49.8%
Total median debt per household: $20,600
Seniors in this bracket are most likely retired and living on a fixed income. At this point, a good rule of thumb is to have little to no debt. While there are fewer and lower levels of borrowing in this bracket compared to the others, close to 50% are carrying debt. While much of this is accounted for by small mortgages, some of it may be related to high cost of medical care and senior living facilities.
Jacob Wackerhausen/istockphoto

Americans have clearly become accustomed to borrowing in order to move through their everyday lives. In fact, financing is often a necessary step in order to get the graduate level training needed for a professional career or to buy a home that will become a financial asset. But are we culturally becoming too comfortable with borrowing larger and larger sums of money? And how do you know when you’ve over-extended yourself?
One way to find out if you’re carrying too much debt is to calculate your debt to income ratio by dividing your monthly debt payments by your monthly income. For instance, if your total debt payments (student loan, credit card, mortgage, car loan, etc.) come to $2,500 per month and your after-tax monthly income is $8,000, your debt-to-income ratio would be 31.25%. That means that a little over 31% of your income goes straight to your debts.
As a rule of thumb, the lower your debt to income ratio the better: a ratio of around 30% is considered very good, while a ratio of 40% or higher could threaten your financial security.
Doucefleur/istockphoto

Carrying debt is enormously stressful, especially if it keeps you from being able to save enough to feel financially secure. Here are some solutions if you’re looking for a strategy for paying down your debt.
Make a Debt Inventory
Start by listing out all of your outstanding debts and sorting them based on whether they are “good” debts (debts taken out to help build wealth or income potential like mortgages and student loans) or “bad” debts (high interest loans and loans to buy things that don’t appreciate like credit cards and auto loans). The bad, or high-risk debts will be the ones you’ll want to take on first.
Create a Debt Pay-Down Goal
Zero in on the loans that cost you the most (in terms of high interest, but also high stress). Then, set a realistic goal for paying it down — as well as a budget for how to swing the extra payments. For instance, you might cut back on some of your unnecessary spending for a set period of time, or choose to take on a side hustle to earn some extra income.
Consider Consolidating Your Debt
If you are carrying a high credit card balance or other high-interest debt, but have a steady income and good credit, you may be able to make your repayment simpler and cheaper by taking out lower-interest personal loans to pay off those debts. You can’t use an unsecured personal loan to consolidate student loan debt, but it can be immensely helpful if you’re trying to get out from under credit card debt.
Likoper/istockphoto

Many Americans have debt, with younger people having more student debt and those in midlife having more in the form of mortgages.
If you’re concerned about managing your debt (especially from credit cards), you might consolidate your high-interest debt into one monthly payment, which might offer a lower interest rate that could help you get out of debt sooner.
This article originally appeared on SoFi.com and was syndicated by MediaFeed.org.
SoFi Loan Products
SoFi loans are originated by SoFi Bank, N.A., NMLS #696891 (Member FDIC). For additional product-specific legal and licensing information, see SoFi.Equal Housing Lender.
Disclaimer: Many factors affect your credit scores and the interest rates you may receive. SoFi is not a Credit Repair Organization as defined under federal or state law, including the Credit Repair Organizations Act. SoFi does not provide “credit repair” services or advice or assistance regarding “rebuilding” or “improving” your credit record, credit history, or credit rating. For details, see the FTC’s website .
Non affiliation: SoFi isn’t affiliated with any of the companies highlighted in this article.
Financial Tips & Strategies: The tips provided on this website are of a general nature and do not take into account your specific objectives, financial situation, and needs. You should always consider their appropriateness given your own circumstances.
fizkes/istockphoto

Saklakova/istockphoto
Featured Image Credit: oatawa/istockphoto.