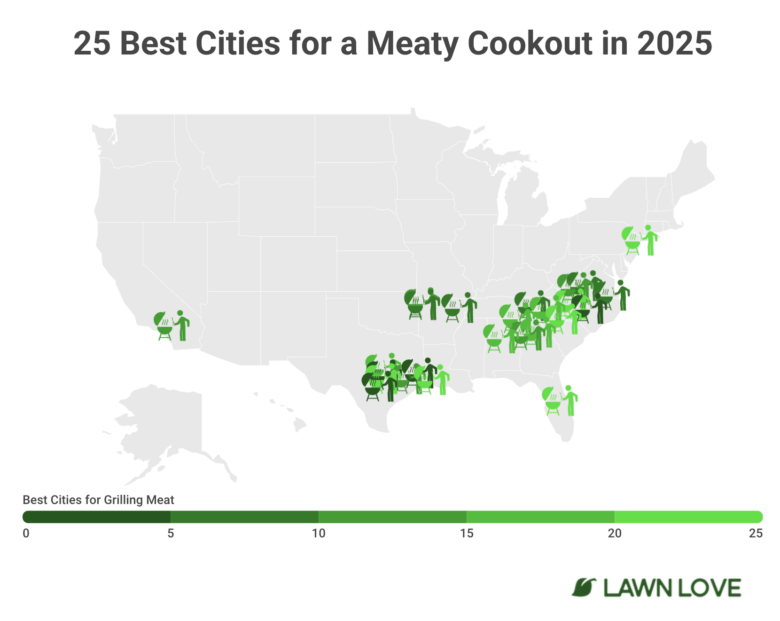
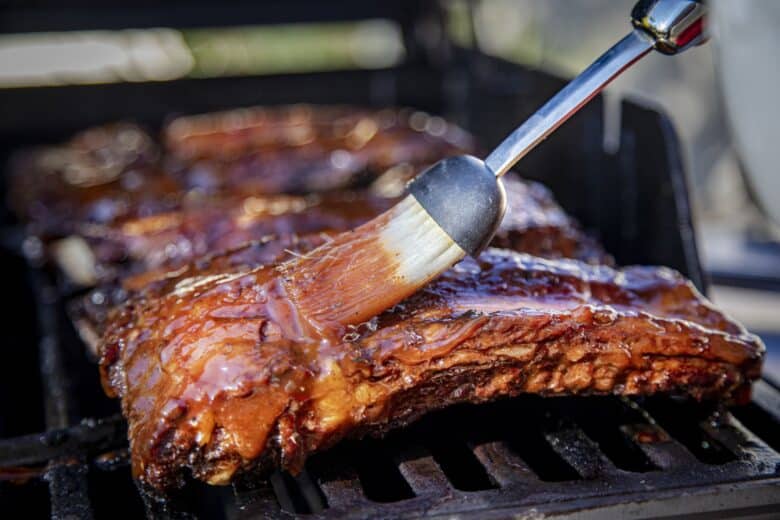
Which U.S. cities boast ideal grilling conditions to fire up some meat?
With tailgating season underway and Labor Day Weekend around the corner, Lawn Love used 15 metrics to rank 2025’s Best Cities for a Meaty Cookout.
A few prime insights:
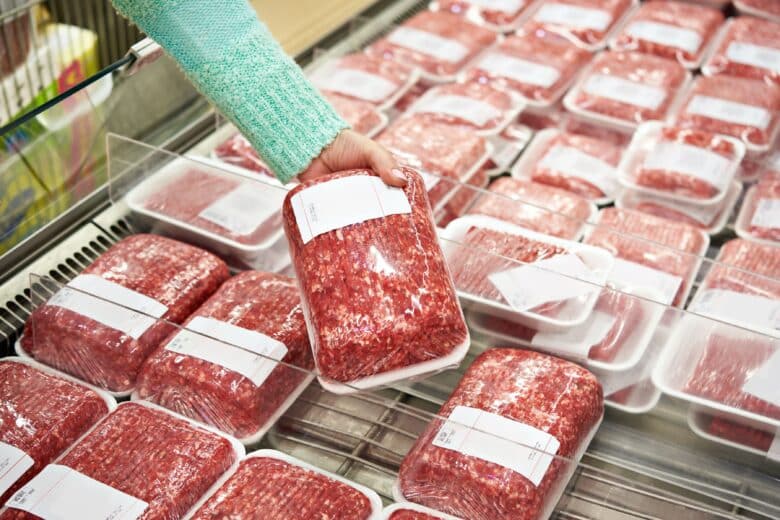
– It’s a bit more expensive to throw burgers on the grill this summer: Average ground beef prices increased by 14% since last year, accounting for inflation.
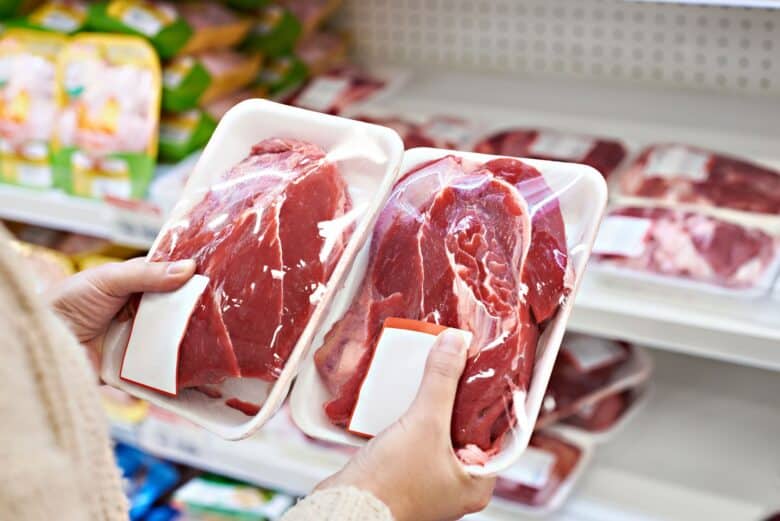
– Across all 411 cities in our ranking, local butcher shops had an average rating of 4.1 stars.
– 394 of the cities in our ranking — 96% — have access to at least 1 butcher shop, and 405 cities — 99% — claim at least 1 meat market.
See where your city ranks below.
Top 5 cities for a meaty cookout

No. 1: Raleigh, North Carolina | Overall score: 61.31
Google Search Interest for Grill-Related Terms: 2,067 | Rank: 1
Number of Butcheries: 11 | Rank: 41
Number of Meat Markets: 11 | Rank: 115
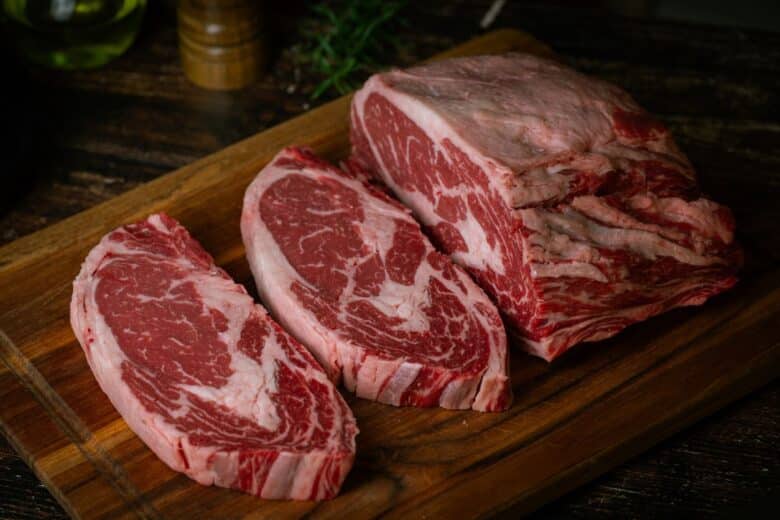
Average Price of a Ribeye Steak: $15.61 | Rank: 92
Yard Size: 0.29 acres | Rank: 82
Local tips: Shop for a prime cut of meat at The Butcher’s Market.
Arrange a meaty picnic with over 80 public grills available at local Raleigh parks.
Plan ahead and reserve a spot for your next NC State Wolfpack tailgate. Look forward to an upgraded tailgating experience in the coming years due to the Lenovo Center Entertainment District renovations.
To learn how we ranked the cities, see our methodology.
2. Georgetown
No. 2: Georgetown, TX | Overall score: 57.95Meat Cost Rank: 11
Meat Access Rank: 346
Environmental Conditions Rank: 110
3. New Braunfels

No. 3: New Braunfels, TX | Overall score: 57.50Meat Cost Rank: 6
Meat Access Rank: 283
Environmental Conditions Rank: 82
4. Tyler

No. 4: Tyler, TX | Overall score: 57.49
Meat Cost Rank: 35
Meat Access Rank: 105
Environmental Conditions Rank: 42
5. Jonesboro
No. 5: Jonesboro, AR | Overall score: 57.39
Meat Cost Rank: 15
Meat Access Rank: 186
Environmental Conditions Rank: 77
2025’s Best Cities for a Meaty Cookout. Full ranking here.
Meaty insights
Pigskins and pork chops: Southern cities with big university football scenes, like Fayetteville, Arkansas (No. 6), Knoxville, Tennessee (No. 8), and Athens, Georgia (No. 16), finish near the top with high local interest, well-rated butcher shops, and large backyards for hosting.
Southern states dominate our ranking, with all cities representing Alabama, Arkansas, Tennessee, and both North and South Carolina scoring in the top half.
Big cities like New York (No. 25) and Los Angeles (No. 27) claim the most top-rated butcheries (22 and 8, respectively). However, smaller cities like Buffalo, New York (No. 91), and Grand Rapids, Michigan (No. 53), stand out among larger metros with 4 top-tier butcher shops (with 4.5+ star ratings and 10+ reviews).
Rain and drought can both dampen a grilling sesh. Cookouts are most likely to get rained out in Miami (No. 265) and Mobile, Alabama (No. 37). Heat is most likely to be an issue for meat lovers in Arizona, Nevada, and Texas. Keep an eye out for adverse weather forecasts and burn bans or other grilling restrictions in your area.
Metric highlights: Cooking your wallet

Where’s the beef? Herds are declining, with an 8% decrease in U.S. cattle inventory since 2019. Meanwhile, beef imports hit a record high in 2024 with over 4.6 billion pounds of imported beef — mostly from Australia, Canada, and Brazil.
Meanwhile, chicken prices decreased in 99 of the cities in our sample as bird flu cases are on the decline.
Prices below are averaged across over 400 of the biggest U.S. cities.
Average Meat Prices (2023)
Ground beef
Cost $5.78 With Inflation $6.12
Sausage
Cost $5.07 With Inflation $5.37
Chicken (per lb)
Cost: $1.73 With Inflation $1.83
Ribeye steak
Cost $13.87 With Inflation $14.70
Average Meat Prices (Q1 2024 – Q1 2025)

Ground beef $7.05
Sausage $5.16
Chicken (per lb) $1.75
Ribeye steak $15.50
Cheapest Average Meat Prices (2023)

Ground beef
City: McAllen, TX
Cost $4.69 With Inflation $4.97
Sausage
City: Westminster, CO
Cost: $4.75 With Inflation: $5.03
Chicken (per lb)
City: Washington, D.C.
Cost: $1.31 With Inflation $1.39
Ribeye steak
City: Beaumont, TX
Cost: $12.56 With Inflation $13.31
Cheapest Average Meat Prices (Q1 2024 – Q1 2025)
Ground beef
City: Overland Park, KS
cost: $6.61
Sausage
City: Edmond, OK
Cost: $4.41
Chicken (per lb)
City: Edinburg, TX
Cost: $1.17
Ribeye steak
City: Lake Charles, LA
Cost: $14.56
Most Expensive Average Meat Prices (2023)

Ground beef
City: Daytona Beach, FL
Cost: $7.04 With Inflation $7.46
Sausage
City: Kent, WA
Cost: $5.85 With Inflation $6.20
Chicken (per lb)
City: Bakersfield, CA
Cost: $3.49 With Inflation $3.70
Ribeye steak
City: Anchorage, AK
Cost: $16 With Inflation $16.95
Most Expensive Average Meat Prices (Q1 2024 – Q1 2025)
Ground beef
City: Anchorage, AK
Cost: $8.49
Sausage
City: San Francisco
Cost: $6.56
Chicken (per lb)
City: Honolulu
Cost: $2.86
Ribeye steak
City: Anchorage, AK
Cost: $17.60
Note: The meat cost metrics were priced as follows:
-
Ribeye steak: Priced per pound.
-
Ground beef: Priced per pound; min. 80% lean.
-
Pork sausage: 1-pound package.
-
Frying chicken: Whole chicken, priced per pound.
Behind the ranking

First, we determined the factors (metrics) that are most relevant to rank the Best Cities for a Meaty Cookout. We then assigned a weight to each factor based on its importance and grouped those factors into 4 categories: Popularity, Meat Cost, Meat Access, and Environmental Conditions. The categories, factors, and their weights are listed in the table below.
For each of the 500 biggest U.S. cities, we then gathered data on each factor from the sources listed below the table. We eliminated 89 cities lacking sufficient data in a single category, resulting in a final sample size of 411 cities.
Finally, we calculated scores (out of 100 points) for each city to determine its rank in each factor, each category, and overall. A city’s Overall Score is the average of its scores across all factors and categories. The highest Overall Score ranked “Best” (No. 1) and the lowest “Worst” (No. 411).
Behind the ranking – Metrics
Metric: Popularity
Metric: Google Search Interest for Grill-Related Terms Over the Past Year adj. by Population
Weighting: 2
Lowest Value 0
Highest Value 2066.86
Best: Highest
Metric: Average Rating for Butcheries
Weighting: 0.5
Lowest Value 1.2
Highest Value 5
Best: Highest
Metric: Number of Top-Rated Butcheries
Weighting: 0.5
Lowest Value 0
Highest Value 22
Best: Highest
Metric: Meat Cost

Metric: Average Price of Ground Beef
Weighting: 1
Lowest Value $6.61
Highest Value $8.49
Best: Lowest
Metric: Avg. Price of Sausage
Weighting: 1
Lowest Value $4.41
Highest Value $6.56
Best: Lowest
Metric: Avg. Price of Chicken
Weighting: 1
Lowest Value $1.17
Highest Value $2.86
Best: Lowest
Metric: Avg. Price of Steak
Weighting: 1
Lowest Value $14.56
Highest Value $17.60
Best: Lowest
Metric: Meat Access

Metric: Number of Butcheries
Weighting: 0.5
Lowest Value 0
Highest Value 180
Best: Lowest: Highest
Metric: Number of Meat Markets
Weighting: 0.5
Lowest Value 0
Highest Value 576
Best: Lowest: Highest
Metric: Environmental Conditions
Metric: Average Monthly Rain (in Inches)
Weighting: 1
Lowest Value 0.35
Highest Value 5.62
Best: Lowest: Lowest
Metric: Number of Very Hot Days
Weighting: 1
Lowest Value 2
Highest Value 170
Best: Lowest: Lowest
Metric: Number of Very Cold Days
Weighting: 1
Lowest Value 0
Highest Value 203
Best: Lowest: Lowest
Metric: Yard Size (sq. ft)
Weighting: 2
Lowest Value 596.32
Highest Value 29,510
Best: Lowest: Highest
Metric: Median Air Quality Index
Weighting: 1
Lowest Value 23
Highest Value 86
Best: Lowest: Lowest
Metric: Wind Speed (mph)
Weighting: 2
Lowest Value 0.8
Highest Value 5.77
Best: Lowest: Lowest
Sources
The Council for Community and Economic Research, Google Ads, National Oceanic and Atmospheric Administration, The Real Yellow Pages, U.S. Environmental Protection Agency, U.S. Federal Housing Finance Agency, and Yelp
Outdoor cooking upgrades

U.S. residents are projected to feast on 226.2 pounds of meat per person in 2025, according to IBISWorld.
Studies show that about 80% of American residents own some kind of grill. While most homeowners prefer cooking on gas or charcoal grills, artificial intelligence is heating up the market.
AI-powered smart grills — with both charcoal and electric models — boast features that assist with cleaning, energy efficiency, and temperature monitoring to prevent tough chicken and chewy steaks. Smart smokeless grills — a global market projected to reach $1.8 billion by 2033 — also allow for safe indoor grilling.
Upgrade your grilling gear and create your dream outdoor kitchen with help from our tips below.
- Grow an edible garden for fresh burger toppings and veggies to throw on the grill.
- Transform your patio and install your grill in an outdoor kitchen.
- Trim back any overgrown bushes or trees near your grill to avoid an accidental fire.
- Design a pizza garden with all the toppings for the perfect pizza to cook on the grill.
- Establish a shady spot in your backyard to escape from the heat.
- After a day of grilling, roast some s’mores over a fire pit or outdoor fireplace for dessert.
Before sparking things up this summer, check with your local HOA, neighborhood, city, and state guidelines to ensure you maintain outdoor cooking compliance and avoid being fined.
Related:
Like MediaFeed’s content? Be sure to follow us.
This article originally appeared on Lawnlove.com and was syndicated by MediaFeed.org