
+23,200 jobs | 0.18%
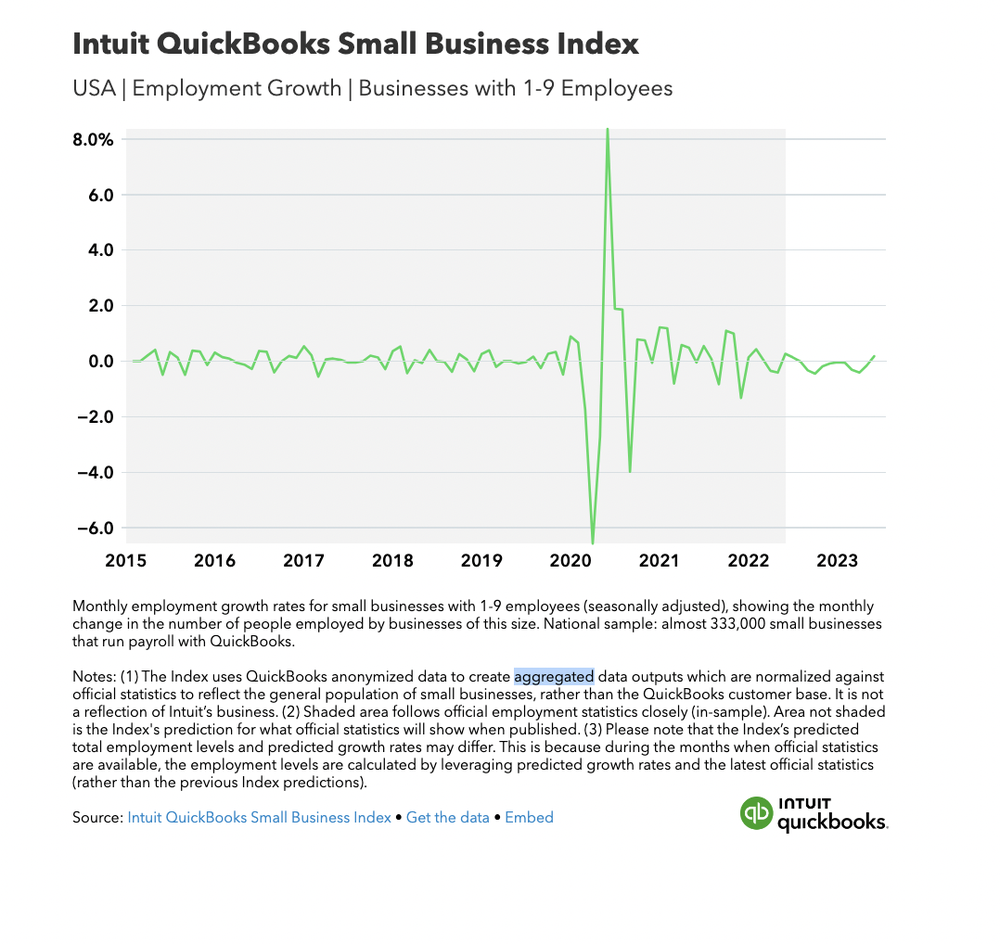
In the US in June, small businesses with one to nine employees created 23,200 jobs — an increase of 0.18% since May. Nationally, these businesses now employ 12,886,500 people*, up from 12,863,300 in the previous month.
This is the first time small business employment has increased in the US since the Intuit QuickBooks Small Business Index was launched in March 2023.
Sectors with the largest small business employment growth
- Agriculture, natural resources, and mining (NAICS 11 & 21): with a monthly growth rate of 0.58%, adding 1,100 jobs. Agriculture includes farming, forestry, fishing, and hunting. Natural resources and mining cover oil and gas extraction, raw materials, and associated support services.
- Construction (NAICS 23): with a monthly growth rate of 0.30%, adding 2,300 jobs. This sector includes both residential and commercial construction.
- Education and health services (NAICS 61 & 62): with a monthly growth rate of 0.17%, adding 4,000 jobs. Education includes business training, sports coaching, and language schools as well as colleges and universities. Health services cover both physical and mental health care.
Information sector leads those with fastest falling small business employment
- Information (NAICS 51): down by 0.51% with 1,500 fewer jobs. This sector includes TV, movies, news media, music, and book publishers as well as software and telecommunications.
- Leisure and hospitality (NAICS 71 & 72): down by 0.33% with 5,200 fewer jobs. Leisure includes museums and attractions, theaters, casinos, golf courses, gyms, and spectator sports. Hospitality includes hotels, bars, coffee shops, and restaurants.
- Utilities, transport, and warehousing (NAICS 22 & 48–49): down by 0.32% with 200 fewer jobs. Utilities include power generation and distribution as well as sewage, irrigation, and air conditioning. Transport and warehousing covers all aspects of private and commercial transport for people and goods — including trucking, taxis, air, rail, and storage.
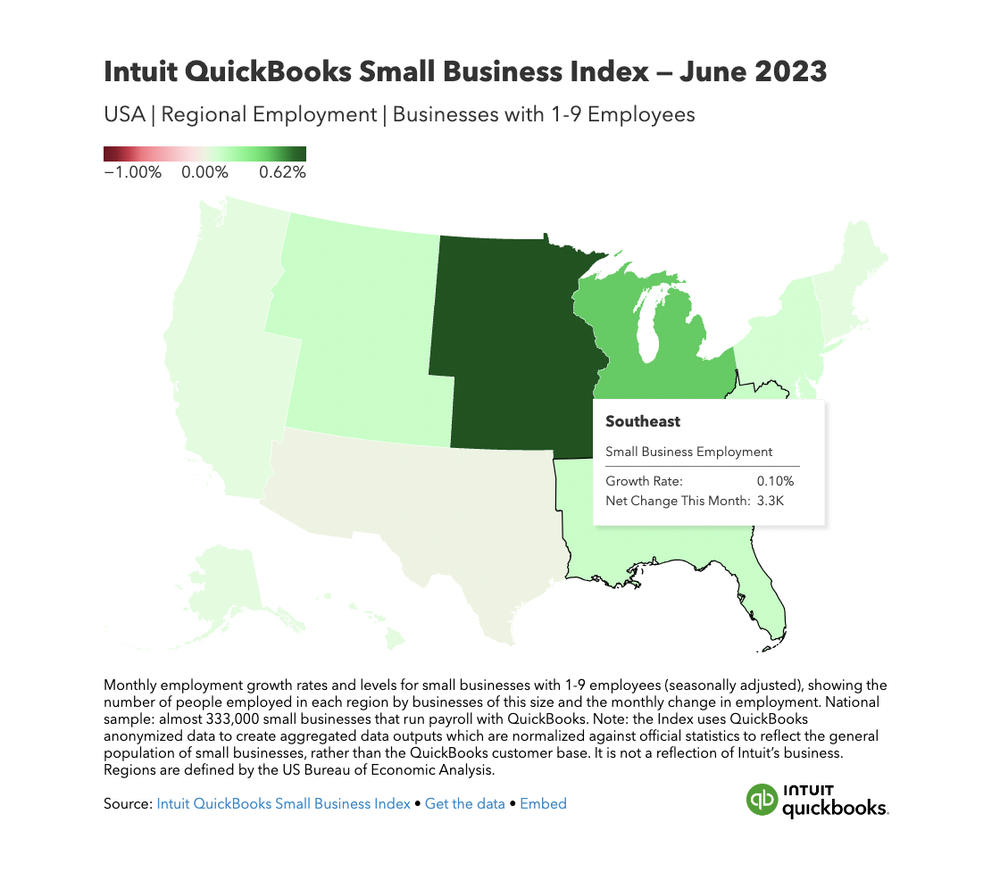
Small business employment rises in seven out of eight regions
Small business employment rose fastest in the Plains region (Iowa, Kansas, Minnesota, Missouri, Nebraska, North Dakota, South Dakota) with a monthly growth rate of 0.62% in June — or 5,400 new jobs created. For the total number of jobs created, the Great Lakes region comes out on top, with 7,300 new jobs — a monthly growth rate of 0.39%. This region covers Illinois, Indiana, Michigan, Ohio, and Wisconsin.
The only US region where small business employment did not grow in June was the Southwest (Arizona, New Mexico, Oklahoma, Texas). But here, employment didn’t fall. The monthly growth rate was flat, at 0%.
Ufuk Akcigit, the Arnold C. Harberger Professor of Economics at the University of Chicago, said: “In May, the inflation rate exhibited a deceleration, with a Consumer Price Index of 4%, marking its lowest level in two years. Additionally, the Federal Reserve broke its pattern of ten consecutive interest rate hikes since March 2022 by opting to skip an increase.
“These developments coincided with a notable upswing in small business optimism, as reported by the National Federation of Independent Business Owners. We are pleased to report that the Intuit QuickBooks Small Business Index has captured these positive momentums in the small business sector, as evidenced by an 0.18% increase in small business employment compared to the previous month.
“This growth is a significant milestone, as it marks the first positive expansion since the launch of our index in March 2023. This may be a signal of improving conditions within the U.S. small business landscape; a close watch of the Index over the next few months will show if this growth trend continues. The positive developments we witnessed in June can primarily be attributed to several factors. Firstly, the easing inflationary pressures played a crucial role in fostering a conducive environment for small business growth. Additionally, the stability of interest rates, and the resilience displayed by the banking sector, further contributed to the expansion of small business activity during this period.
“The construction sector emerged as one of the top-performing industries, experiencing a notable 0.30% increase in small business employment. This growth may be attributed to the robust demand for housing coupled with limited supply, which has driven an expansion of new construction activities. The Homebuilder Sentiment Index, which measures National Association of Homebuilders members’ views on market conditions for the sale of new homes, reached its highest level in 11 months. This data point further corroborates the power of the insights of the Intuit QuickBooks Small Business Index. These indicators collectively may suggest a positive outlook for the construction sector and reflect the industry’s resilience in the face of prevailing market conditions.
“Although there have been variations observed across different sectors and regions, the overall outlook for small business activities in the US this month appears to show some signs of promise.”
Get all the details from the interactive Small Business Index dashboard.
About the Index
The Intuit QuickBooks Small Business Index is a timely new measure of small business employment and hiring in the US, Canada, and the UK. The Index launched in March 2023 and is updated monthly. The Index uses purpose-built economic models to normalize anonymized QuickBooks data to reflect the general population of small businesses in each country; it is not a reflection of Intuit’s business. The Index was developed in collaboration with leading economist Professor Ufuk Akcigit and an international team of researchers and academics.
Methodology
The Intuit QuickBooks Small Business Index creates aggregated data outputs from a sample of anonymized QuickBooks Online Payroll customer records which are calibrated using statistical methods to create modeled results which better reflect the general population of small businesses in each country, as represented by published official statistics. Statistical adjustment ensures the Index truly reflects employment and job vacancy changes rather than trends in the
Read more or download the full methodology here.
Rounded values
Total and monthly changes in employment and job vacancies have been rounded to the nearest hundred. Monthly changes and growth rates are calculated before total employment or job vacancy values are rounded. Rates have been rounded to the nearest hundredth.
Seasonal adjustments
The Index’s data insights are seasonally adjusted to limit the effect of seasonal patterns in employment and hiring throughout the year, which lead to regular fluctuations in workforce growth and contraction.
Employment growth formula
Employment growth(t) = [Employment(t)-Employment(t-1)]/[0.5*Employment(t)+0.5*Employment(t-1)]
*Employment levels
The Index produces a monthly prediction of employment growth rates by country, region, and sector. In order to translate these growth rates into the number of jobs/vacancies gained or lost, the growth rates are multiplied by the prior month’s predicted employment levels, except during the months when official statistics are published. During those months, the latest official employment levels that have been reported are used in the calculation instead of the Index’s prior month’s predicted employment levels. As a result, the Index’s predicted total employment levels may at times differ from the predicted growth rates. Official statistics are published at different frequencies depending on the country ranging from monthly to quarterly.
Time series
The Index uses data going back to January 2015 in the US and Canada and to January 2018 in the UK. Published at the earliest opportunity every month, the Index shows the number of people employed by small businesses (in the US and Canada) or the number of job vacancies at small businesses (in the UK) in the previous month and how that number has changed since the month before. The Index helps to eliminate almost all of the time lags in official statistics by providing estimated projections of what those statistics will ultimately show when they are published.
Sample sizes
The total sample across all three countries is around 424,000 small businesses. The US sample is almost 333,000 small businesses. The Canadian sample is almost 66,000 small businesses. The UK sample is almost 25,000 small businesses. The minimum sample sizes for regions or sectors to be included in the Index are 1,000 small businesses in the US, 800 small businesses in Canada, and 200 small businesses in the UK.
Target populations
In the US and UK, the Index targets the populations of small businesses with one to nine employees. In Canada, the target population is small businesses with one to 19 employees. The differences ensure the Index’s data insights are consistent with official statistics in each country, which are used for benchmarking during the calibration process. Timely data insights for these populations of small businesses are particularly valuable since most datasets fail to cover this portion of the economy well. Please note: Unlike in the US and Canada, the UK Index uses job vacancy data for calibration rather than employment data because official employment statistics are not currently available for small businesses on a monthly basis.
External data sources
External data sources used alongside the samples of anonymized QuickBooks Online Payroll customer data include:
- U.S. Bureau of Labor Statistics Business Employment Dynamics (BED) and Job Openings and Labor Turnover Survey (JOLTS)
- U.S. Bureau of Economic Analysis regions
Geographic regions
- USA data insights are divided into Bureau of Economic Analysis (BEA) regions
Industry sectors
- USA data insights are available by North American Industry Classification System (NAICS) sectors
This article originally appeared on the Quickbooks Resource Center and was syndicated by MediaFeed.org.
Do you make more than the average person in your state?

Whether you’re deciding on a new career path or wondering whether you’re being paid enough, it can help to know what the typical American worker earns per year.
Based on the latest data available from the Social Security Administration (SSA), the average annual pay in the U.S. in 2021 was $60,575 — an 8.89% jump from the previous year. The U.S. Bureau of Labor Statistics (BLS) estimates the average worker made closer to $67,610 that same year. The amount you make may depend on a number of factors, including your occupation, where you live, your gender, and your level of education.
AndreyPopov / iStock

Let’s take a closer look at how the average annual pay in the U.S. has changed over a three-year period based on data from both the SSA and BLS.
Average Annual Salary per SSA, per BLS:
- 2019: $54,099.99, $59,209
- 2020: $55,628.60, $64,021
- 2021: $60,575.07, $67,610
It can also be helpful to look at median earnings, which represent the midpoint of salaries in the U.S. In other words, half of the salaries fall below the median, and half are higher than the median.
The following table shows the median annual salary for a three-year period.
Median Annual Salary by Year:
- 2022: $54,132
- 2021: $51,896
- 2020: $51,168
As you can see, average and median incomes have risen each year. However, average salaries can be affected by various factors such as your occupation, age, and gender. Note that the numbers above also don’t include unearned income.
PeopleImages/istockphoto

Some industries tend to pay more than others, which means the career you choose may affect how much you earn. Here’s a sampling of high-paying jobs and their average annual salary, according to the BLS:
- Cardiologist, $353,970 per year
- Dentist, $177,770
- Aircraft pilots and flight engineer, $169,540
- Lawyer and judicial law clerk, $146,220
- Public relations manager, $138,000
- Air traffic controller, $127,920
(Learn more atHome Affordability Calculator).
PeopleImages/istockphoto

While salaries tend to vary based on geography, seeing how much certain types of jobs pay can be informative. Let’s take a look at different occupations and how much they typically pay.
Keep in mind that average salaries may differ depending on the specific occupation you have. For example, although claims adjusters fall under the business and financial operations category, their average salary is around $70,960.
Sofi

Demographics, specifically gender, are another factor to consider. By and large, men tend to outearn women throughout their career. The median annual salary for a 16- to 24-year-old man is $33,800; a woman of the same age earns $31,460, per the latest data available from the BLS. Likewise, the median annual salary for a man aged 25 and older is $60,320; a woman of the same age earns $49,608.
stefanamer/istockphoto

Wages often vary based on where you live. In many cases, states with higher costs of living also have higher wages. For example, the median annual income in Hawaii is $100,532 — much higher than Mississippi’s median annual income of $61,205.
Below is the median income by state for a household of three people, according to data compiled by the Census Bureau between April 1 and May 14, 2022.
rez-art/istockphoto

Average pay: $70,250
Sean Pavone/istockphoto

Average pay: $108,072
chaolik/istockphoto

Average pay: $79,110
Davel5957/istockphoto

Average pay: $70,169
Sean Pavone/istockphoto

Average pay: $97,092
Spondylolithesis/istockphoto

Average pay: $100,744
milehightraveler/istockphoto

Average pay: $108,409
DenisTangneyJr/istockphoto

Average pay: $96,841
pabradyphoto/istockphoto

Average pay: $138,342
Sean Pavone/istockphoto

Average pay: $75,057
DoxaDigital/istockphoto

Average pay: $75,057
SeanPavonePhoto/istockphoto

Average pay: $100,532
Art Wager/istockphoto

Average pay: $76,635
Sean Pavone/istockphoto

Average pay: $97,067
Shelly Bychowski/istockphoto

Average pay: $81,783
Sean Pavone/istockphoto

Average pay: $85,758
Jacob Boomsma/istockphoto

Average pay: $88,369
TriggerPhoto/istockphoto

Average pay: $71,501
Davel5957/istockphoto

Average pay: $71,371
ghornephoto/istockphoto

Average pay: $87,051
Sean Pavone/istockphoto

Average pay: $113,994
ferrantraite/istockphoto

Average pay: $117,415
ivanastar/istockphoto

Average pay: $84,245
pawel.gaul/istockphoto

Average pay: $106,445
Davel5957/istockphoto

Average pay: $61,205
peeterv/istockphoto

Average pay: $80,022 (Learn more atThings to do in St Louis)
Art Wager/istockphoto

Average pay: $79,652
powerofforever/istockphoto

Average pay: $91,076
Matt Bills/istockphoto

Average pay: $113,013
DenisTangneyJr/istockphoto

Average pay: $91,076
4kodiak/istockphoto

Average pay: $117,697
Ultima_Gaina/istockphoto

Average pay: $66,183
Sean Pavone/istockphoto

Average pay: $96,854
TriggerPhoto / istockphoto

Average pay: $76,386
Sean Pavone/istockphoto

Average pay: $94,950
Solange_Z/istockphoto

Average pay: $82,734
Jeremy Poland/istockphoto

Average pay: $71,397
Tiago_Fernandez/istockphoto

Average pay: $93,773
BruceBlock/istockphoto

Average pay: $92,441
Sean Pavone/istockphoto

Average pay: $101,104
SeanPavonePhoto/istockphoto

Average pay: $75,128
SeanPavonePhoto/istockphoto

Average pay: $87,475
DenisTangneyJr/istockphoto

Average pay: $75,394
benedek/istockphoto

Average pay: $80,733
Sean Pavone/istockphoto

Average pay: $90,629
f11photo/istockphoto

Average pay: $92,628
DenisTangneyJr/istockphoto

Average pay: $102,869
ferrantraite/istockphoto

Average pay: $104,644
400tmax/istockphoto

Average pay: $71,757
DenisTangneyJr/istockphoto

Average pay: $92,586
benkrut/istockphoto

Average pay: $88,902
DenisTangneyJr/istockphoto

As the BLS data below shows, there is often a pay disparity among workers of different races and ethnicities.
- Asian, $69,056 per year
- White, $52,936
- Black or African American, $41,652
- Hispanic or Latino, $40,404
Sanja Radin/istockphoto

Now that you’ve seen some of the average and median annual salaries by occupation, location, gender, and race or ethnicity, how does yours compare? If you’re not making as much as you’d like, you may want to research wages in your industry and region, and use that information to help you negotiate a higher salary. If you’re ready to make a bigger change, you can use this data as you consider whether to switch to a more lucrative field or relocate to a higher-paying region.
Drazen Zigic/istockphoto

Here are some different strategies to help you make the most of the money you make:
Track Your Spending
Understanding exactly where your money is going can help you keep tabs on where your money is going and identify areas where you can cut back. Consider using a spending app to track your spending and saving.
Negotiate Bills
Want to lower monthly expenses, such as your cell phone or internet services? Consider calling up various providers to see if you’re able to get a better deal or if there are promotions you can take advantage of.
Cut Back on Large Expenses
Housing, food, and transportation tend to be the largest line budget items. Explore ways to trim your biggest costs. Examples include refinancing your mortgage, negotiating your rent, shopping at discount grocery stores, and taking public transportation when possible.
Sharpen Your Marketable Skills
Accepting networking opportunities and taking professional development courses could help you become more marketable as an employee. This in turn could set you up to earn more in the long run. If you’re on a tight budget, look into no- or low-cost ways to cultivate high-income skills, and ask your employer if there are any free resources are available.
SARINYAPINNGAM/istockphoto

A high income can be great, but it does come with some downsides.
Pros:
- Improved quality of life: With more money, you can afford a higher standard of living and be able to afford different amenities such as better access to healthcare and food.
- Financial security: The more you earn, the more you can feel secure you have enough money to afford the things you want and need.
- Ability to achieve financial goals faster: Having more disposable income could mean you can set more money aside for long- and short-term savings goals, like retirement or going on a family vacation.
Cons:
- Higher taxes: Earning more can put you in a higher tax bracket. However, there are ways to reduce your taxable income.
- Pressure to maintain income: If you’re accustomed to a certain living standard, you may feel like you need to keep earning the same amount or more to maintain it.
- More work stress: In many cases, higher-paying jobs come with more responsibilities and at times, longer hours.
Drazen Zigic/istockphoto

Understanding what the average American worker makes in a year can come in handy, especially if you’re considering a new career path, negotiating a higher salary, or looking for a new place to live. According to the latest data from the Social Security Administration, the average annual pay in the U.S. is $60,575. But the amount you earn may depend on a wide range of factors, such as the industry you work in, where you live, your gender, and your race or ethnicity.
This article originally appeared on SoFi.com and was syndicated by MediaFeed.org.
Please understand that this information provided is general in nature and shouldn’t be construed as a recommendation or solicitation of any products offered by SoFi’s affiliates and subsidiaries. In addition, this information is by no means meant to provide investment or financial advice, nor is it intended to serve as the basis for any investment decision or recommendation to buy or sell any asset. Keep in mind that investing involves risk, and past performance of an asset never guarantees future results or returns. It’s important for investors to consider their specific financial needs, goals, and risk profile before making an investment decision.
The information and analysis provided through hyperlinks to third party websites, while believed to be accurate, cannot be guaranteed by SoFi. These links are provided for informational purposes and should not be viewed as an endorsement. No brands or products mentioned are affiliated with SoFi, nor do they endorse or sponsor this content.
Communication of SoFi Wealth LLC an SEC Registered Investment Advisor
SoFi isn’t recommending and is not affiliated with the brands or companies displayed. Brands displayed neither endorse or sponsor this article. Third party trademarks and service marks referenced are property of their respective owners.
Communication of SoFi Wealth LLC an SEC Registered Investment Adviser. Information about SoFi Wealth’s advisory operations, services, and fees is set forth in SoFi Wealth’s current Form ADV Part 2 (Brochure), a copy of which is available upon request and at here. Liz Young is a Registered Representative of SoFi Securities and Investment Advisor Representative of SoFi Wealth. Her ADV 2B is available at here.
PeopleImages/istockphoto

Doucefleur/istockphoto
Featured Image Credit: visualspace/istockphoto.