
All Rise
As we approach the midpoint of the year, and after a strong rally in parts of the market, an exploration of where things currently sit is warranted. After all, first we have to know where we are before trying to figure out where we’re going and how we might get there.
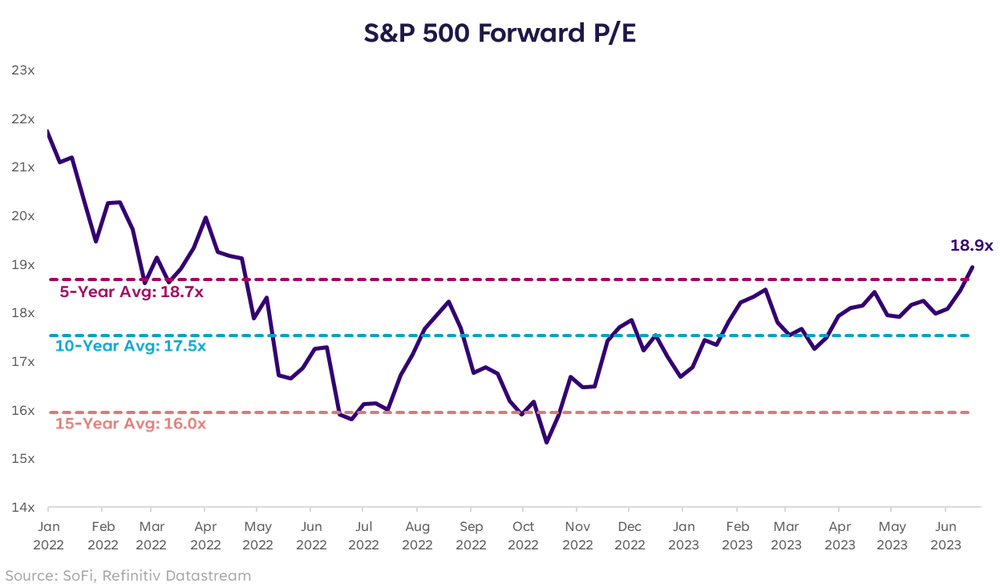
The most straightforward measure of current conditions is valuations, particularly the price-to-earnings ratio (PE). Some may argue that PEs don’t matter as much as they used to, or that they’re not the right way to gauge risk and direction, but they remain one of the most easily measurable metrics for stocks. And when we’re trying to make rational investment decisions for the long term, measuring things is important.
Since March 13, when the regional bank stress was at its peak, the S&P 500 is up over 13%, the Nasdaq is up over 20%, and the Nasdaq 100 (the largest and most active non-financial companies listed on the Nasdaq) is up almost 25%. It’s no surprise that during the last couple weeks we started to hear more and more about stocks having gone “too far, too fast” or approaching overbought conditions.
But how do we know for sure? That’s the fun of it, we never know for sure. Maybe my definition of fun is different from yours…in any event, as things stand today I can say that PEs feel high, at least for the broad S&P index.
Sloping Arguments
When I was in school, which is starting to feel like a lifetime ago, I remember math teachers defining the slope of a line as the “rise over the run,” and that catchy phrase runs through my mind often to this day, and even more often lately.
How quickly a line rises vs. how long it took to get there (the “run”) is not a metric that we can mathematically determine is too fast, too slow, or just right. But we can visualize it on charts, and compare it to prior quick rallies.
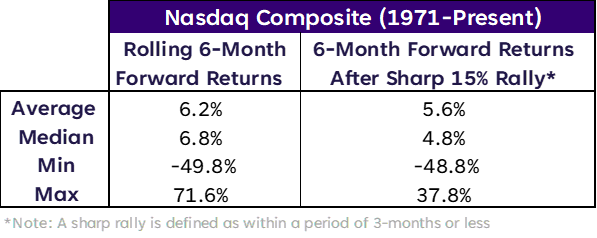
The issue with this is that the dispersion of results is wide. After rallies of 15% or more that occurred over a 3-month period, the Nasdaq has posted decent results more often than not over subsequent 6-month timeframes, but the results are below average and the max is well below average. In other words, the takeaway is mixed — average returns following a sharp rally are positive, but unimpressive. And there remains a chance for outsized negative returns.
Momentum is a powerful force and it can carry markets upward for long periods of time, but it shouldn’t be confused with durability. This environment of Fed tightening and shrinking liquidity may not be friendly to steep upward sloping lines.
Hung Jury
The last metric worth mentioning is the number of stocks trading above their 200-day moving average and how it’s improved over recent weeks. This is a measure of breadth, and one that wasn’t looking very promising just a few weeks ago, but it’s improved notably in June with now more than 60% of S&P constituents trading above that threshold.
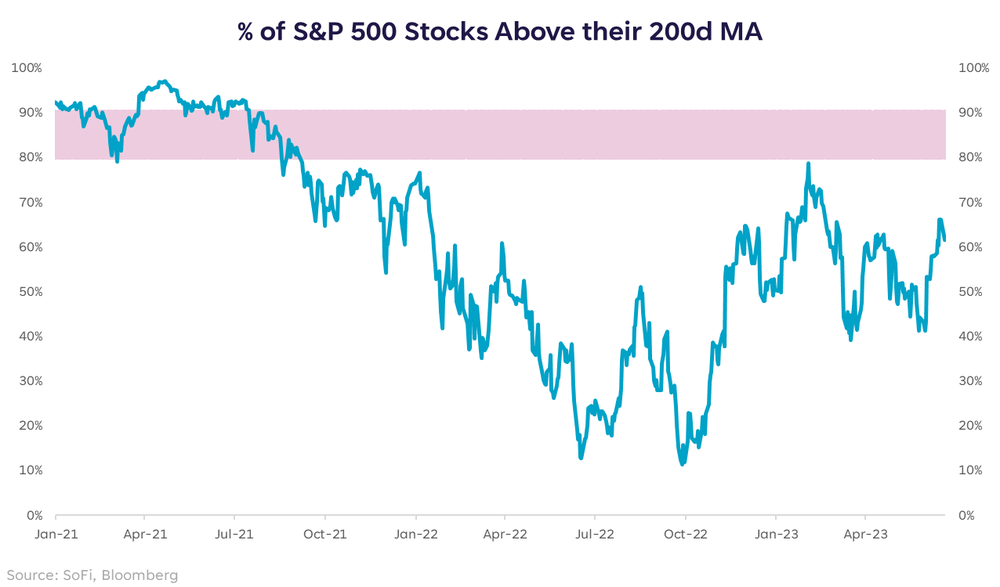
After many weeks of only a handful of big stocks leading markets higher, the participation of other stocks in this rally is a welcome change. But it’s not quite enough to be convincing of a new bull market, when 80-90% of constituents are typically trading above their 200d MA for most of the first year off a major bottom.
That could mean that we’re still fighting our way into a new bull market and there’s room to broaden out from here, or it could mean we’re still in a longer-term downtrend with maddening headfakes along the way. Oddly, the metric above that draws the least clear conclusion, the slope, is the one that nags at me the most. We won’t know until we know whether this is a new bull or a pesky bear, but the steep slope of the line upward makes me uneasy, and reluctant to flip into bull mode.
This article originally appeared on SoFi.com and was syndicated by MediaFeed.org.
Please understand that this information provided is general in nature and shouldn’t be construed as a recommendation or solicitation of any products offered by SoFi’s affiliates and subsidiaries. In addition, this information is by no means meant to provide investment or financial advice, nor is it intended to serve as the basis for any investment decision or recommendation to buy or sell any asset. Keep in mind that investing involves risk, and past performance of an asset never guarantees future results or returns. It’s important for investors to consider their specific financial needs, goals, and risk profile before making an investment decision.
The information and analysis provided through hyperlinks to third party websites, while believed to be accurate, cannot be guaranteed by SoFi. These links are provided for informational purposes and should not be viewed as an endorsement. No brands or products mentioned are affiliated with SoFi, nor do they endorse or sponsor this content.
Communication of SoFi Wealth LLC an SEC Registered Investment Advisor
SoFi isn’t recommending and is not affiliated with the brands or companies displayed. Brands displayed neither endorse or sponsor this article. Third party trademarks and service marks referenced are property of their respective owners.
Communication of SoFi Wealth LLC an SEC Registered Investment Adviser. Information about SoFi Wealth’s advisory operations, services, and fees is set forth in SoFi Wealth’s current Form ADV Part 2 (Brochure), a copy of which is available upon request and at here. Liz Young is a Registered Representative of SoFi Securities and Investment Advisor Representative of SoFi Wealth. Her ADV 2B is available at here.
The best American small towns for real estate investing

For our list of the best cities to invest in real estate in the U.S., we looked at the largest 600 cities in the U.S. and found the ones where home ownership costs are low and rents are high. For our list of the best suburbs to invest in real estate, we looked at communities outside big cities. But what about small cities? For this list of the best small cities to invest in real estate in 2022, we looked at cities in the U.S. with populations between 10,000 and 99,000.
Using data from Zillow and the U.S. Census, we looked at data for about 3,800 cities in the U.S. with populations between 10,000 and 99,000 and crunched the numbers to find the best small cities for investing in real estate in 2022.
We found that for investors looking for smaller-city investments, Arkansas is a good place to start—five of our top 10 cities are in the “Natural State.”
photovs/iStock

Typical home value: $238,980
Five-year home value appreciation: 79.3%
Effective property tax rate: 0.7%
Rental vacancy rate: 5.8%
Rent-to-home-value ratio: 5.0%
Rent-to-income ratio: 21.3%
Pensacola has a typical home value that is 31% below the national average, and the five-year appreciation rate is 29% above average. Effective tax rate is 37% below average, and the rental vacancy rate is the same as the national average at 5.8%.
George Dodd/iStock

Typical home value: $152,479
Five-year home value appreciation: 45.8%
Effective property tax rate: 0.6%
Rental vacancy rate: 4.4%
Rent-to-home-value ratio: 5.8%
Rent-to-income ratio: 18.3%
Paragould has a typical home value that is 56% below the national average, and the five-year home value appreciation rate is 26% below the national average. The effective property tax is 46% below average, and the rental vacancy rate is 24% below average.
Roberto Galan/iStock

Typical home value: $222,972
Five-year home value appreciation: 79.9%
Effective property tax rate: 0.9%
Rental vacancy rate: 1.0%
Rent-to-home value ratio: 3.5%
Rent-to-income ratio:18.7%
San Luis has typical home values 35% below the national average, with a five-year appreciation rate of 30% above the national average. The effective property tax rate is 23% below average, and the rental vacancy rate is 83% below average.
Ken Lund/Flickr

Typical home value: $273,648
Five-year home value appreciation: 73.6%
Effective property tax rate: 0.7%
Rental vacancy rate: 4.6%
Rent-to-home-value ratio: 3.4%
Rent-to-income ratio:18.1%
Typical home value is Springdale is 20% below average, and five-year appreciation rate is 20% above the national average. Effective property tax rates are 39% below average, and rental vacancy is 21% below average.
Brandonrush/ Wikipedia

Typical home value: $297,153
Five-year home value appreciation: 79.3%
Effective property tax rate: 0.8%
Rental vacancy rate: 1.6%
Rent-to-home value ratio: 3.9%
Rent-to-income ratio: 16.1%
Bella Vista has typical home prices 14% below average and a five-year appreciation rate 29% above the national average. Effective property taxes are 25% below average, and the rental vacancy rate is 72% below average.
Cal Wolfe/iStock

Typical home value: $126,787
Five-year home value appreciation: 39.3%
Effective property tax rate: 0.6%
Rental vacancy rate: 2.5%
Rent-to-home value ratio: 6.0%
Rent-to-income ratio: 14.1%
Typical home value in Batesville is 63% below the national average, and five-year home value appreciation is also below the national average (36% below). Effective property tax is 42% below average, and the rental vacancy rate is 57% below average.
Kennethrorie/Wikipedia

Typical home value: $314,114
Five-year home value appreciation: 73.2%
Effective property tax rate: 0.7%
Rental vacancy rate: 2.5%
Rent-to-home-value ratio: 3.6%
Rent-to-income ratio: 17.2%
Half our list of the top 10 small cities for real estate investing are in Arkansas, and Rogers scored highest of the Arkansas cities on the list. Typical home values are 9% below the national average, but five-year appreciation is 19% above average. Effective property tax rate is 35% below average, and rental vacancy is 57% below average.
doug_wertman/Flickr

Typical home value: $361,106
Five-year home value appreciation: 66.4%
Effective property tax rate: 0.5%
Rental vacancy rate: 2.8%
Rent-to-home-value ratio: 3.3%
Rent-to-income ratio:12.6%
Home values in Madison are 5% above the national average, and home value appreciation is 8% above the national average. The effective property tax rate is 53% below average, and the rental vacancy rate is 52% below the national average.
Wikipedia

Typical home value: $161,137
Five-year home value appreciation: 79.0%
Effective property tax rate: 0.8%
Rental vacancy rate: 1.9%
Rent-to-home value ratio: 5.5%
Rent-to-income ratio: 16.6%
Webb City’s typical home value is 53% below the national average, and the five-year home value appreciation is 28% above the national average. The effective property tax rate is 30% below average, and the rental vacancy rate is 67% below average.
BD Images/iStock

Typical home value: $140,646
Five-year home value appreciation: 49.8%
Effective property tax rate: 0.5%
Rental vacancy rate: 1.0%
Rent-to-home-value ratio: 5.0%
Rent-to-income ratio: 15.0%
Bluffton is the best small city to invest in real estate, based on our analysis. Its typical home value is 59% below the national average. Home value appreciation is 19% below the national average, but effective property taxes are, too — 51% below the average. Rental vacancy is 83% below average.
Roberto Galan/iStock

To find and rank the best small cities to invest in real estate for 2022, we looked at 3,800 cities and towns in the U.S. with populations between 10,000 and 99,000, and evaluated them over over six data points:
-
Home value: Typical home value from April 2022 (Zillow data)
-
Home value appreciation: Percentage increase in home value in the last five years, April 2017 to April 2022 (Zillow data)
-
Effective property tax rate: Median annual property taxes divided by median annual home value (Census data)
-
Rent-to-home-value ratio: Median annual rent divided by home value (Zillow and Census data)
-
Rental vacancy rate: Percentage of the city’s rental inventory that is vacant for rent (Census data)
-
Rent-to-income ratio: Median annual rent divided by median household income (Census data)
We weighed each factor equally and scored cities based on these factors. Our top small cities are characterized by low home values (you want to be able to afford property there); high home value appreciation (you want your house to go up in value, making your investment worth more both for future sale and future rental value); low effective property tax rate (lower taxes mean better margins); high rent-to-home-value ratio (you’ll recoup your money sooner because rents are high compared to what you’ll spend on the house); low rental vacancy (so you can definitely find tenants at the price you want); and low rent-to-income ratio (because tenants who can better afford rent are probably less likely to default or miss payments).
U.S. averages as of April 2022:
Typical home value (low is better): $344,141
Five-year home value appreciation (high is better): 61.5%
Effective property tax rate (low is better): 1.1%
Rental vacancy rate (low is better): 5.8%
We also looked at the rent-to-home-value ratio and rent-to-income ratio as indicators of how rental-friendly cities were. National data was not available for those numbers, but for the cities in our study, the averages were 6.2% and 25%, respectively.
This article originally appeared on Policygenius.com and was syndicated by MediaFeed.org
DepositPhotos.com

adamkaz
Featured Image Credit: gopixa / istockphoto.