
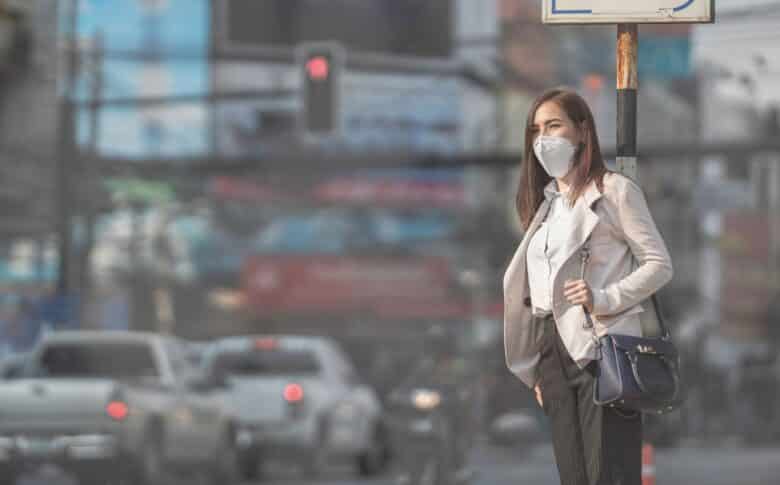
According to a newly released report by the American Lung Association, the number of Americans exposed to unhealthy spikes in air pollution has been constantly rising, taking a jump up in the latest observation period of 2018 to 2020. The data shows that most recently, 63.2 million Americans lived in counties where average air quality did not necessarily fail the ALA’s standards, but extreme fluctuations in the quality of the ambient air nevertheless took place.
Image Credit: torwai / iStock.
More Americans Exposed

The number of Americans exposed to these spikes rose from 49.6 million in four years, while the number of Americans exposed to unhealthy ozone pollution sank and the number of those suffering from year-round unhealthy air stagnated.
The ALA estimates that in 2018-2020, approximately 137 million Americans were exposed to any of these three types of hazardous pollution levels (year-round, unhealthy spikes and ozone). This is 2 million more than in last year’s report, but still far less than the 150 million affected between 2016 and 2018 or the 166 million affected in 2012 to 2014.
Image Credit: Максим Шмаков / istockphoto.
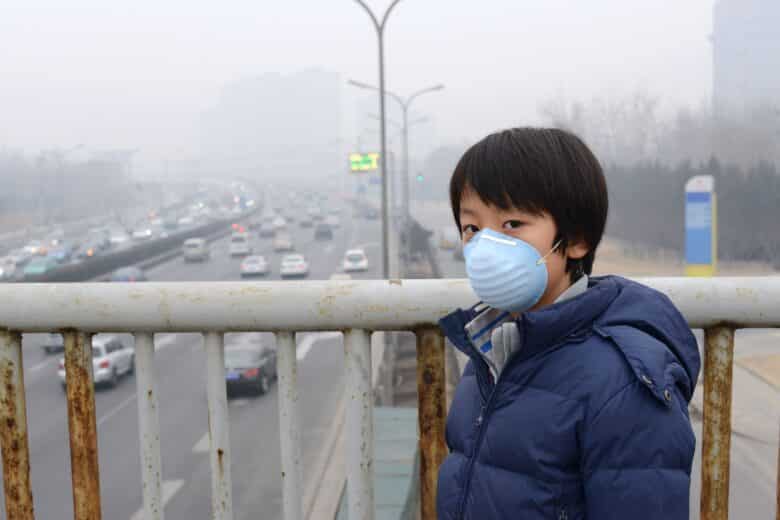
Where Pollution is Spiking the Most
Most cities experiencing unhealthy spikes were located in the Western United States, according to the report. Major wildfire and drought activity in the region in recent years contributed to sudden extreme spikes in unhealthy air measurements. Major cities affected by spikes were San Francisco, Sacramento, Los Angeles, Phoenix, Seattle and Salt Lake City. The only Eastern city among the worst 25 for spikes of unhealthy air was Pittsburgh, where industrial pollution continues to pose a problem.
Image Credit: torwai / iStock.
Year-Round Pollution by Year

- Number of people living in U.S. counties with unhealthy air pollution levels (in millions), 2015-2017: 20.5
- Number of people, 2016-2018: 21.2
- Number of people, 2017-2019: 20.9
- Number of people, 2018-2022: 20.9
Image Credit: NuttKomo / iStock.
Unhealthy Spikes by Year

- Number of people living in U.S. counties with unhealthy air pollution levels (in millions), 2015-2017: 49.6
- Number of people, 2016-2018: 53.3
- Number of people, 2017-2019: 54.4
- Number of people, 2018-2022: 63.2
Image Credit: Jun / iStock.
Ozone Pollution by Year
- Number of people living in U.S. counties with unhealthy air pollution levels (in millions), 2015-2017: 134
- Number of people, 2016-2018: 137
- Number of people, 2017-2019: 123.2
- Number of people, 2018-2022: 122.3
Image Credit: Hung_Chung_Chih / iStock.
Methodology

Statista tracked changes in air pollution using data from the American Lung Association. Data is based on the number of Americans living in counties that received a failing grade using ALA’s standards. You can find more information here.
This article originally appeared on Statista.com and was syndicated by MediaFeed.org.
Image Credit: Werawad Ruangjaroon / iStock.
More from MediaFeed

This art is garbage. Literally
Image Credit: WashedAshore.org.